Holospora undulata HU1
Taxonomy: cellular organisms; Bacteria; Proteobacteria; Alphaproteobacteria; Holosporales; Holosporaceae; Holospora; Holospora undulata
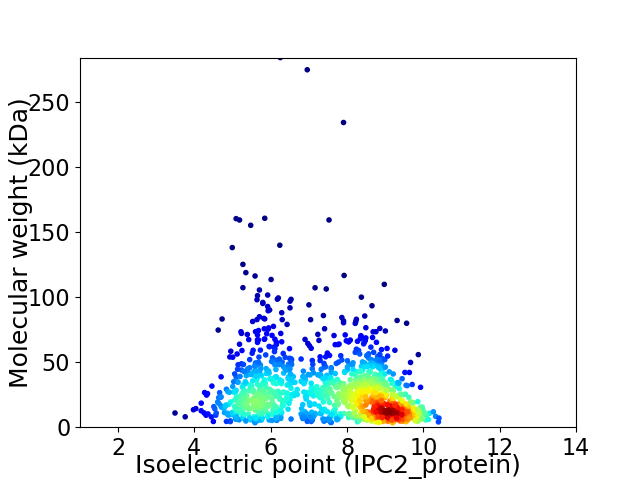
Average proteome isoelectric point is 7.44
Get precalculated fractions of proteins

Virtual 2D-PAGE plot for 1184 proteins (isoelectric point calculated using IPC2_protein)
Get csv file with sequences according to given criteria:
* You can choose from 21 different methods for calculating isoelectric point
Summary statistics related to proteome-wise predictions


Protein with the lowest isoelectric point:
>tr|A0A061JGD9|A0A061JGD9_9PROT Uncharacterized protein OS=Holospora undulata HU1 OX=1321371 GN=K737_300550 PE=4 SV=1
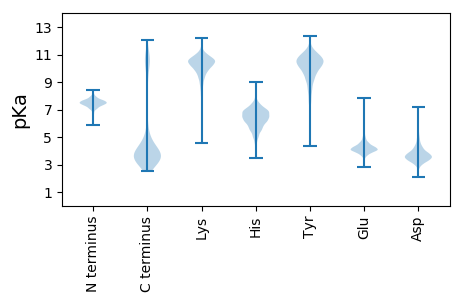
MM1 pKa = 7.51LIDD4 pKa = 4.19WFQEE8 pKa = 3.97LSDD11 pKa = 4.29CSPLGNHH18 pKa = 6.57QIFLSNFISSNEE30 pKa = 3.69MVRR33 pKa = 11.84FKK35 pKa = 11.1EE36 pKa = 3.98LLKK39 pKa = 10.81SKK41 pKa = 10.36YY42 pKa = 10.41DD43 pKa = 3.3RR44 pKa = 11.84FFSYY48 pKa = 10.64NRR50 pKa = 11.84YY51 pKa = 9.88NSLNQHH57 pKa = 6.02SYY59 pKa = 11.48DD60 pKa = 4.56LIMNNAIFLQTIGDD74 pKa = 3.78NAFVTGIYY82 pKa = 9.87QKK84 pKa = 10.8YY85 pKa = 9.88NEE87 pKa = 4.21WLRR90 pKa = 11.84NSTAPDD96 pKa = 4.04DD97 pKa = 4.94DD98 pKa = 4.91SEE100 pKa = 4.66TVLDD104 pKa = 4.57GNSDD108 pKa = 3.59NYY110 pKa = 11.62DD111 pKa = 3.76DD112 pKa = 5.9FDD114 pKa = 5.82DD115 pKa = 5.87SEE117 pKa = 4.87TEE119 pKa = 4.07MYY121 pKa = 10.86
MM1 pKa = 7.51LIDD4 pKa = 4.19WFQEE8 pKa = 3.97LSDD11 pKa = 4.29CSPLGNHH18 pKa = 6.57QIFLSNFISSNEE30 pKa = 3.69MVRR33 pKa = 11.84FKK35 pKa = 11.1EE36 pKa = 3.98LLKK39 pKa = 10.81SKK41 pKa = 10.36YY42 pKa = 10.41DD43 pKa = 3.3RR44 pKa = 11.84FFSYY48 pKa = 10.64NRR50 pKa = 11.84YY51 pKa = 9.88NSLNQHH57 pKa = 6.02SYY59 pKa = 11.48DD60 pKa = 4.56LIMNNAIFLQTIGDD74 pKa = 3.78NAFVTGIYY82 pKa = 9.87QKK84 pKa = 10.8YY85 pKa = 9.88NEE87 pKa = 4.21WLRR90 pKa = 11.84NSTAPDD96 pKa = 4.04DD97 pKa = 4.94DD98 pKa = 4.91SEE100 pKa = 4.66TVLDD104 pKa = 4.57GNSDD108 pKa = 3.59NYY110 pKa = 11.62DD111 pKa = 3.76DD112 pKa = 5.9FDD114 pKa = 5.82DD115 pKa = 5.87SEE117 pKa = 4.87TEE119 pKa = 4.07MYY121 pKa = 10.86
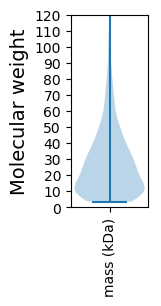
Molecular weight: 14.31 kDa
Isoelectric point according different methods:
Protein with the highest isoelectric point:
>tr|A0A061JGA4|A0A061JGA4_9PROT Putative HTH-type transcriptional regulator YdcH OS=Holospora undulata HU1 OX=1321371 GN=K737_300635 PE=4 SV=1
MM1 pKa = 7.38ARR3 pKa = 11.84ISGVNIPEE11 pKa = 4.29KK12 pKa = 10.85KK13 pKa = 10.17NLLSGLICIHH23 pKa = 6.74GIGRR27 pKa = 11.84FKK29 pKa = 10.94ALEE32 pKa = 4.04VCRR35 pKa = 11.84SLGLDD40 pKa = 2.74YY41 pKa = 10.59HH42 pKa = 7.22ARR44 pKa = 11.84VSEE47 pKa = 4.08LSEE50 pKa = 3.98KK51 pKa = 10.77DD52 pKa = 2.81IVRR55 pKa = 11.84IRR57 pKa = 11.84EE58 pKa = 4.28MIDD61 pKa = 2.77KK62 pKa = 9.5EE63 pKa = 4.43YY64 pKa = 10.99VVEE67 pKa = 5.17GEE69 pKa = 4.15LRR71 pKa = 11.84NNNLMSKK78 pKa = 9.82KK79 pKa = 10.18RR80 pKa = 11.84LMDD83 pKa = 4.16LGCYY87 pKa = 9.58RR88 pKa = 11.84GLRR91 pKa = 11.84HH92 pKa = 6.56RR93 pKa = 11.84KK94 pKa = 8.43NLPARR99 pKa = 11.84GQRR102 pKa = 11.84THH104 pKa = 5.64TNARR108 pKa = 11.84TRR110 pKa = 11.84RR111 pKa = 11.84GRR113 pKa = 11.84AVAIAGKK120 pKa = 10.21KK121 pKa = 8.86KK122 pKa = 10.57
MM1 pKa = 7.38ARR3 pKa = 11.84ISGVNIPEE11 pKa = 4.29KK12 pKa = 10.85KK13 pKa = 10.17NLLSGLICIHH23 pKa = 6.74GIGRR27 pKa = 11.84FKK29 pKa = 10.94ALEE32 pKa = 4.04VCRR35 pKa = 11.84SLGLDD40 pKa = 2.74YY41 pKa = 10.59HH42 pKa = 7.22ARR44 pKa = 11.84VSEE47 pKa = 4.08LSEE50 pKa = 3.98KK51 pKa = 10.77DD52 pKa = 2.81IVRR55 pKa = 11.84IRR57 pKa = 11.84EE58 pKa = 4.28MIDD61 pKa = 2.77KK62 pKa = 9.5EE63 pKa = 4.43YY64 pKa = 10.99VVEE67 pKa = 5.17GEE69 pKa = 4.15LRR71 pKa = 11.84NNNLMSKK78 pKa = 9.82KK79 pKa = 10.18RR80 pKa = 11.84LMDD83 pKa = 4.16LGCYY87 pKa = 9.58RR88 pKa = 11.84GLRR91 pKa = 11.84HH92 pKa = 6.56RR93 pKa = 11.84KK94 pKa = 8.43NLPARR99 pKa = 11.84GQRR102 pKa = 11.84THH104 pKa = 5.64TNARR108 pKa = 11.84TRR110 pKa = 11.84RR111 pKa = 11.84GRR113 pKa = 11.84AVAIAGKK120 pKa = 10.21KK121 pKa = 8.86KK122 pKa = 10.57
Molecular weight: 13.92 kDa
Isoelectric point according different methods:
Peptides (in silico digests for buttom-up proteomics)
Below you can find in silico digests of the whole proteome with Trypsin, Chymotrypsin, Trypsin+LysC, LysN, ArgC proteases suitable for different mass spec machines.| Try ESI |
 |
|---|
| ChTry ESI |
 |
|---|
| ArgC ESI |
 |
|---|
| LysN ESI |
 |
|---|
| TryLysC ESI |
 |
|---|
| Try MALDI |
 |
|---|
| ChTry MALDI |
 |
|---|
| ArgC MALDI |
 |
|---|
| LysN MALDI |
 |
|---|
| TryLysC MALDI |
 |
|---|
| Try LTQ |
 |
|---|
| ChTry LTQ |
 |
|---|
| ArgC LTQ |
 |
|---|
| LysN LTQ |
 |
|---|
| TryLysC LTQ |
 |
|---|
| Try MSlow |
 |
|---|
| ChTry MSlow |
 |
|---|
| ArgC MSlow |
 |
|---|
| LysN MSlow |
 |
|---|
| TryLysC MSlow |
 |
|---|
| Try MShigh |
 |
|---|
| ChTry MShigh |
 |
|---|
| ArgC MShigh |
 |
|---|
| LysN MShigh |
 |
|---|
| TryLysC MShigh |
 |
|---|
General Statistics
Number of major isoforms |
Number of additional isoforms |
Number of all proteins |
Number of amino acids |
Min. Seq. Length |
Max. Seq. Length |
Avg. Seq. Length |
Avg. Mol. Weight |
|---|---|---|---|---|---|---|---|
0 |
309843 |
29 |
2435 |
261.7 |
29.71 |
Amino acid frequency
Ala |
Cys |
Asp |
Glu |
Phe |
Gly |
His |
Ile |
Lys |
Leu |
|---|---|---|---|---|---|---|---|---|---|
6.05 ± 0.071 | 1.685 ± 0.036 |
4.51 ± 0.066 | 6.508 ± 0.093 |
5.559 ± 0.089 | 6.031 ± 0.089 |
2.325 ± 0.044 | 6.908 ± 0.058 |
7.676 ± 0.107 | 10.634 ± 0.072 |
Met |
Asn |
Gln |
Pro |
Arg |
Ser |
Thr |
Val |
Trp |
Tyr |
|---|---|---|---|---|---|---|---|---|---|
2.27 ± 0.032 | 4.304 ± 0.088 |
3.827 ± 0.05 | 4.224 ± 0.059 |
4.576 ± 0.053 | 7.674 ± 0.061 |
4.441 ± 0.054 | 6.191 ± 0.08 |
1.393 ± 0.04 | 3.215 ± 0.042 |
Most of the basic statistics you can see at this page can be downloaded from this CSV file
Proteome-pI is available under Creative Commons Attribution-NoDerivs license, for more details see here
| Reference: Kozlowski LP. Proteome-pI 2.0: Proteome Isoelectric Point Database Update. Nucleic Acids Res. 2021, doi: 10.1093/nar/gkab944 | Contact: Lukasz P. Kozlowski |
