Coniosporium apollinis (strain CBS 100218) (Rock-inhabiting black yeast)
Taxonomy: cellular organisms; Eukaryota; Opisthokonta; Fungi; Dikarya; Ascomycota; saccharomyceta; Pezizomycotina; leotiomyceta; dothideomyceta; Dothideomycetes; Dothideomycetes incertae sedis; Coniosporium; Coniosporium apollinis
Average proteome isoelectric point is 6.53
Get precalculated fractions of proteins

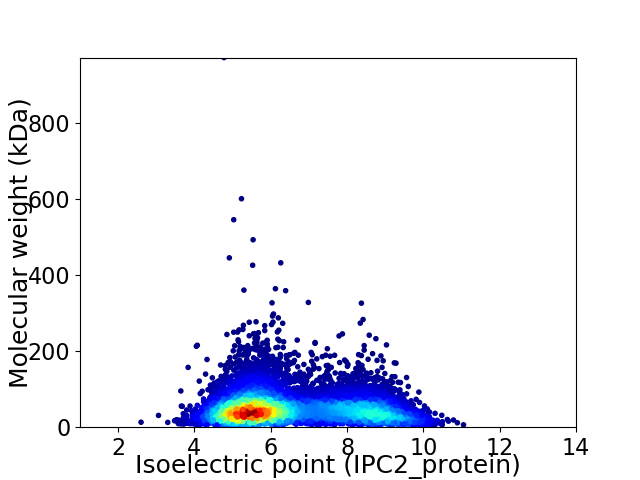
Virtual 2D-PAGE plot for 9306 proteins (isoelectric point calculated using IPC2_protein)
Get csv file with sequences according to given criteria:
* You can choose from 21 different methods for calculating isoelectric point
Summary statistics related to proteome-wise predictions


Protein with the lowest isoelectric point:
>tr|R7YZP4|R7YZP4_CONA1 Uncharacterized protein OS=Coniosporium apollinis (strain CBS 100218) OX=1168221 GN=W97_06517 PE=4 SV=1
MM1 pKa = 7.33ILAPVFLILSTTTLISAQYY20 pKa = 8.85TGYY23 pKa = 11.01SLTSSGDD30 pKa = 3.49PGSVVYY36 pKa = 9.4STSSTPANVSADD48 pKa = 3.58PAPDD52 pKa = 3.17VFLNATVHH60 pKa = 5.69VGEE63 pKa = 4.69IDD65 pKa = 3.17ISVSNLTAKK74 pKa = 10.69LNLDD78 pKa = 3.6AQVLQLLSFNAGVDD92 pKa = 3.57LSIDD96 pKa = 3.55RR97 pKa = 11.84VSLLLADD104 pKa = 4.04VDD106 pKa = 4.22ASVQLEE112 pKa = 4.05VRR114 pKa = 11.84LEE116 pKa = 3.93NLVRR120 pKa = 11.84MINNTLDD127 pKa = 3.83SLDD130 pKa = 4.67LNPILATIGQTVGDD144 pKa = 4.36IANSTLGGLTGGSSPLLAARR164 pKa = 11.84SYY166 pKa = 10.69EE167 pKa = 3.92LEE169 pKa = 3.88NNILYY174 pKa = 10.42SVNDD178 pKa = 3.59YY179 pKa = 11.33SGNTHH184 pKa = 6.12TNRR187 pKa = 11.84ILAQDD192 pKa = 3.84GSIVDD197 pKa = 3.58QSLDD201 pKa = 3.33NDD203 pKa = 3.82GNVYY207 pKa = 9.41NQQVVGSYY215 pKa = 9.67EE216 pKa = 4.26RR217 pKa = 11.84DD218 pKa = 3.2MAFVEE223 pKa = 4.34EE224 pKa = 4.46NEE226 pKa = 4.3GKK228 pKa = 10.08VVNGQAVRR236 pKa = 11.84EE237 pKa = 4.11LEE239 pKa = 4.14YY240 pKa = 10.93VYY242 pKa = 10.84TPFDD246 pKa = 3.67GLSAVCAIYY255 pKa = 10.91VDD257 pKa = 3.64VAGAVVATQVLSEE270 pKa = 4.14SRR272 pKa = 11.84GGGTSTVGADD282 pKa = 3.28LL283 pKa = 4.52
MM1 pKa = 7.33ILAPVFLILSTTTLISAQYY20 pKa = 8.85TGYY23 pKa = 11.01SLTSSGDD30 pKa = 3.49PGSVVYY36 pKa = 9.4STSSTPANVSADD48 pKa = 3.58PAPDD52 pKa = 3.17VFLNATVHH60 pKa = 5.69VGEE63 pKa = 4.69IDD65 pKa = 3.17ISVSNLTAKK74 pKa = 10.69LNLDD78 pKa = 3.6AQVLQLLSFNAGVDD92 pKa = 3.57LSIDD96 pKa = 3.55RR97 pKa = 11.84VSLLLADD104 pKa = 4.04VDD106 pKa = 4.22ASVQLEE112 pKa = 4.05VRR114 pKa = 11.84LEE116 pKa = 3.93NLVRR120 pKa = 11.84MINNTLDD127 pKa = 3.83SLDD130 pKa = 4.67LNPILATIGQTVGDD144 pKa = 4.36IANSTLGGLTGGSSPLLAARR164 pKa = 11.84SYY166 pKa = 10.69EE167 pKa = 3.92LEE169 pKa = 3.88NNILYY174 pKa = 10.42SVNDD178 pKa = 3.59YY179 pKa = 11.33SGNTHH184 pKa = 6.12TNRR187 pKa = 11.84ILAQDD192 pKa = 3.84GSIVDD197 pKa = 3.58QSLDD201 pKa = 3.33NDD203 pKa = 3.82GNVYY207 pKa = 9.41NQQVVGSYY215 pKa = 9.67EE216 pKa = 4.26RR217 pKa = 11.84DD218 pKa = 3.2MAFVEE223 pKa = 4.34EE224 pKa = 4.46NEE226 pKa = 4.3GKK228 pKa = 10.08VVNGQAVRR236 pKa = 11.84EE237 pKa = 4.11LEE239 pKa = 4.14YY240 pKa = 10.93VYY242 pKa = 10.84TPFDD246 pKa = 3.67GLSAVCAIYY255 pKa = 10.91VDD257 pKa = 3.64VAGAVVATQVLSEE270 pKa = 4.14SRR272 pKa = 11.84GGGTSTVGADD282 pKa = 3.28LL283 pKa = 4.52
Molecular weight: 29.73 kDa
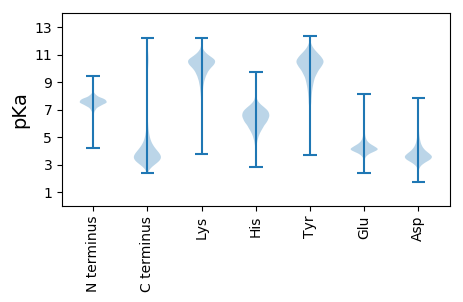
Isoelectric point according different methods:
Protein with the highest isoelectric point:
>tr|R7YW04|R7YW04_CONA1 Uncharacterized protein OS=Coniosporium apollinis (strain CBS 100218) OX=1168221 GN=W97_05237 PE=3 SV=1
MM1 pKa = 7.88PSHH4 pKa = 6.91KK5 pKa = 10.39SFRR8 pKa = 11.84TKK10 pKa = 10.45QKK12 pKa = 9.84LAKK15 pKa = 9.55AQKK18 pKa = 8.59QNRR21 pKa = 11.84PIPQWIRR28 pKa = 11.84LRR30 pKa = 11.84TGNTIRR36 pKa = 11.84YY37 pKa = 5.79NAKK40 pKa = 8.89RR41 pKa = 11.84RR42 pKa = 11.84HH43 pKa = 4.15WRR45 pKa = 11.84KK46 pKa = 7.38TRR48 pKa = 11.84IGII51 pKa = 4.0
MM1 pKa = 7.88PSHH4 pKa = 6.91KK5 pKa = 10.39SFRR8 pKa = 11.84TKK10 pKa = 10.45QKK12 pKa = 9.84LAKK15 pKa = 9.55AQKK18 pKa = 8.59QNRR21 pKa = 11.84PIPQWIRR28 pKa = 11.84LRR30 pKa = 11.84TGNTIRR36 pKa = 11.84YY37 pKa = 5.79NAKK40 pKa = 8.89RR41 pKa = 11.84RR42 pKa = 11.84HH43 pKa = 4.15WRR45 pKa = 11.84KK46 pKa = 7.38TRR48 pKa = 11.84IGII51 pKa = 4.0
Molecular weight: 6.25 kDa
Isoelectric point according different methods:
Peptides (in silico digests for buttom-up proteomics)
Below you can find in silico digests of the whole proteome with Trypsin, Chymotrypsin, Trypsin+LysC, LysN, ArgC proteases suitable for different mass spec machines.| Try ESI |
 |
|---|
| ChTry ESI |
 |
|---|
| ArgC ESI |
 |
|---|
| LysN ESI |
 |
|---|
| TryLysC ESI |
 |
|---|
| Try MALDI |
 |
|---|
| ChTry MALDI |
 |
|---|
| ArgC MALDI |
 |
|---|
| LysN MALDI |
 |
|---|
| TryLysC MALDI |
 |
|---|
| Try LTQ |
 |
|---|
| ChTry LTQ |
 |
|---|
| ArgC LTQ |
 |
|---|
| LysN LTQ |
 |
|---|
| TryLysC LTQ |
 |
|---|
| Try MSlow |
 |
|---|
| ChTry MSlow |
 |
|---|
| ArgC MSlow |
 |
|---|
| LysN MSlow |
 |
|---|
| TryLysC MSlow |
 |
|---|
| Try MShigh |
 |
|---|
| ChTry MShigh |
 |
|---|
| ArgC MShigh |
 |
|---|
| LysN MShigh |
 |
|---|
| TryLysC MShigh |
 |
|---|
General Statistics
Number of major isoforms |
Number of additional isoforms |
Number of all proteins |
Number of amino acids |
Min. Seq. Length |
Max. Seq. Length |
Avg. Seq. Length |
Avg. Mol. Weight |
|---|---|---|---|---|---|---|---|
0 |
4486276 |
43 |
8951 |
482.1 |
53.17 |
Amino acid frequency
Ala |
Cys |
Asp |
Glu |
Phe |
Gly |
His |
Ile |
Lys |
Leu |
|---|---|---|---|---|---|---|---|---|---|
9.349 ± 0.023 | 1.112 ± 0.01 |
5.621 ± 0.017 | 6.509 ± 0.027 |
3.532 ± 0.017 | 7.097 ± 0.024 |
2.331 ± 0.012 | 4.498 ± 0.017 |
4.764 ± 0.021 | 8.797 ± 0.028 |
Met |
Asn |
Gln |
Pro |
Arg |
Ser |
Thr |
Val |
Trp |
Tyr |
|---|---|---|---|---|---|---|---|---|---|
2.097 ± 0.01 | 3.383 ± 0.013 |
6.306 ± 0.031 | 3.973 ± 0.02 |
6.521 ± 0.021 | 7.987 ± 0.026 |
5.886 ± 0.017 | 6.154 ± 0.018 |
1.402 ± 0.009 | 2.68 ± 0.012 |
Most of the basic statistics you can see at this page can be downloaded from this CSV file
Proteome-pI is available under Creative Commons Attribution-NoDerivs license, for more details see here
| Reference: Kozlowski LP. Proteome-pI 2.0: Proteome Isoelectric Point Database Update. Nucleic Acids Res. 2021, doi: 10.1093/nar/gkab944 | Contact: Lukasz P. Kozlowski |
