Tropicimonas sp. IMCC6043
Taxonomy: cellular organisms; Bacteria; Proteobacteria; Alphaproteobacteria; Rhodobacterales; Roseobacteraceae; Tropicimonas; unclassified Tropicimonas
Average proteome isoelectric point is 6.16
Get precalculated fractions of proteins

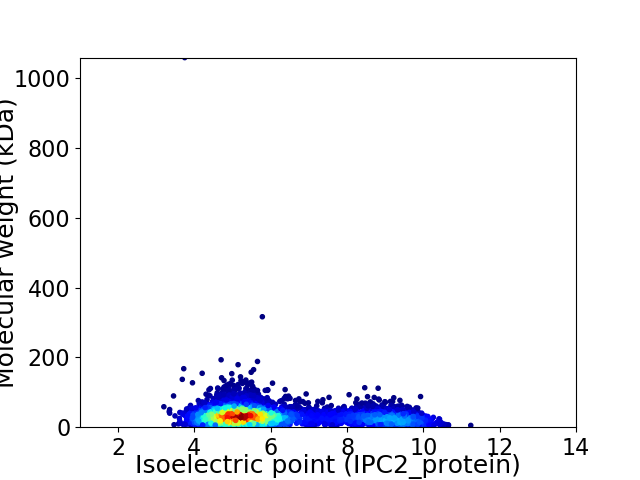
Virtual 2D-PAGE plot for 5038 proteins (isoelectric point calculated using IPC2_protein)
Get csv file with sequences according to given criteria:
* You can choose from 21 different methods for calculating isoelectric point
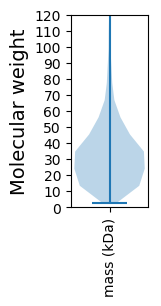
Summary statistics related to proteome-wise predictions


Protein with the lowest isoelectric point:
>tr|A0A4Q3Z7Z2|A0A4Q3Z7Z2_9RHOB Nucleoside triphosphate pyrophosphohydrolase OS=Tropicimonas sp. IMCC6043 OX=2510645 GN=EU800_12730 PE=4 SV=1
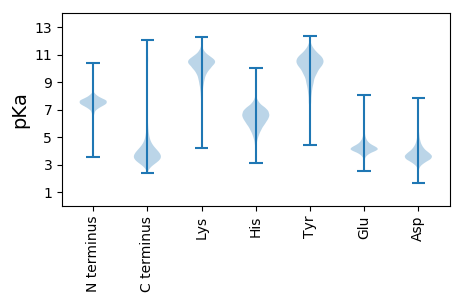
MM1 pKa = 6.42FTSRR5 pKa = 11.84IAICTAISMLALAGTASAQSAGEE28 pKa = 3.87WTLGFGAAYY37 pKa = 10.78SMPKK41 pKa = 9.48YY42 pKa = 10.51DD43 pKa = 5.0NGYY46 pKa = 9.84FDD48 pKa = 5.97PDD50 pKa = 3.53NTSSNQTVTVSDD62 pKa = 3.77TASLTFTGEE71 pKa = 3.63YY72 pKa = 10.01FIWDD76 pKa = 3.59NVGVEE81 pKa = 4.53LLVPLPFSHH90 pKa = 6.84SADD93 pKa = 3.38VEE95 pKa = 4.64DD96 pKa = 3.99YY97 pKa = 11.18GKK99 pKa = 10.61AVDD102 pKa = 4.13LTYY105 pKa = 10.2FAPTLSLQYY114 pKa = 10.23HH115 pKa = 5.79FRR117 pKa = 11.84ASEE120 pKa = 3.99QISYY124 pKa = 10.87LIGLGVNYY132 pKa = 9.51STFTDD137 pKa = 3.64VSTSGDD143 pKa = 3.79LKK145 pKa = 11.38GLDD148 pKa = 3.87LDD150 pKa = 4.03VDD152 pKa = 3.9NSFGGALHH160 pKa = 7.12LGLDD164 pKa = 3.83YY165 pKa = 11.16WMSDD169 pKa = 3.28DD170 pKa = 3.79SAIRR174 pKa = 11.84ADD176 pKa = 3.91MRR178 pKa = 11.84WISIDD183 pKa = 3.12TDD185 pKa = 3.35ADD187 pKa = 3.58AGGSRR192 pKa = 11.84VGEE195 pKa = 3.96IEE197 pKa = 3.93VDD199 pKa = 3.63PFILGLSYY207 pKa = 10.32IRR209 pKa = 11.84KK210 pKa = 8.69FF211 pKa = 3.35
MM1 pKa = 6.42FTSRR5 pKa = 11.84IAICTAISMLALAGTASAQSAGEE28 pKa = 3.87WTLGFGAAYY37 pKa = 10.78SMPKK41 pKa = 9.48YY42 pKa = 10.51DD43 pKa = 5.0NGYY46 pKa = 9.84FDD48 pKa = 5.97PDD50 pKa = 3.53NTSSNQTVTVSDD62 pKa = 3.77TASLTFTGEE71 pKa = 3.63YY72 pKa = 10.01FIWDD76 pKa = 3.59NVGVEE81 pKa = 4.53LLVPLPFSHH90 pKa = 6.84SADD93 pKa = 3.38VEE95 pKa = 4.64DD96 pKa = 3.99YY97 pKa = 11.18GKK99 pKa = 10.61AVDD102 pKa = 4.13LTYY105 pKa = 10.2FAPTLSLQYY114 pKa = 10.23HH115 pKa = 5.79FRR117 pKa = 11.84ASEE120 pKa = 3.99QISYY124 pKa = 10.87LIGLGVNYY132 pKa = 9.51STFTDD137 pKa = 3.64VSTSGDD143 pKa = 3.79LKK145 pKa = 11.38GLDD148 pKa = 3.87LDD150 pKa = 4.03VDD152 pKa = 3.9NSFGGALHH160 pKa = 7.12LGLDD164 pKa = 3.83YY165 pKa = 11.16WMSDD169 pKa = 3.28DD170 pKa = 3.79SAIRR174 pKa = 11.84ADD176 pKa = 3.91MRR178 pKa = 11.84WISIDD183 pKa = 3.12TDD185 pKa = 3.35ADD187 pKa = 3.58AGGSRR192 pKa = 11.84VGEE195 pKa = 3.96IEE197 pKa = 3.93VDD199 pKa = 3.63PFILGLSYY207 pKa = 10.32IRR209 pKa = 11.84KK210 pKa = 8.69FF211 pKa = 3.35
Molecular weight: 22.91 kDa
Isoelectric point according different methods:
Protein with the highest isoelectric point:
>tr|A0A4V1V6Q4|A0A4V1V6Q4_9RHOB Peptidoglycan-binding protein OS=Tropicimonas sp. IMCC6043 OX=2510645 GN=EU800_12775 PE=4 SV=1
MM1 pKa = 7.45KK2 pKa = 9.61RR3 pKa = 11.84TFQPSNLVRR12 pKa = 11.84KK13 pKa = 9.18RR14 pKa = 11.84RR15 pKa = 11.84HH16 pKa = 4.42GFRR19 pKa = 11.84ARR21 pKa = 11.84MATKK25 pKa = 10.37AGRR28 pKa = 11.84KK29 pKa = 8.54ILNARR34 pKa = 11.84RR35 pKa = 11.84ARR37 pKa = 11.84GRR39 pKa = 11.84KK40 pKa = 9.07SLSAA44 pKa = 3.93
MM1 pKa = 7.45KK2 pKa = 9.61RR3 pKa = 11.84TFQPSNLVRR12 pKa = 11.84KK13 pKa = 9.18RR14 pKa = 11.84RR15 pKa = 11.84HH16 pKa = 4.42GFRR19 pKa = 11.84ARR21 pKa = 11.84MATKK25 pKa = 10.37AGRR28 pKa = 11.84KK29 pKa = 8.54ILNARR34 pKa = 11.84RR35 pKa = 11.84ARR37 pKa = 11.84GRR39 pKa = 11.84KK40 pKa = 9.07SLSAA44 pKa = 3.93
Molecular weight: 5.14 kDa
Isoelectric point according different methods:
Peptides (in silico digests for buttom-up proteomics)
Below you can find in silico digests of the whole proteome with Trypsin, Chymotrypsin, Trypsin+LysC, LysN, ArgC proteases suitable for different mass spec machines.| Try ESI |
 |
|---|
| ChTry ESI |
 |
|---|
| ArgC ESI |
 |
|---|
| LysN ESI |
 |
|---|
| TryLysC ESI |
 |
|---|
| Try MALDI |
 |
|---|
| ChTry MALDI |
 |
|---|
| ArgC MALDI |
 |
|---|
| LysN MALDI |
 |
|---|
| TryLysC MALDI |
 |
|---|
| Try LTQ |
 |
|---|
| ChTry LTQ |
 |
|---|
| ArgC LTQ |
 |
|---|
| LysN LTQ |
 |
|---|
| TryLysC LTQ |
 |
|---|
| Try MSlow |
 |
|---|
| ChTry MSlow |
 |
|---|
| ArgC MSlow |
 |
|---|
| LysN MSlow |
 |
|---|
| TryLysC MSlow |
 |
|---|
| Try MShigh |
 |
|---|
| ChTry MShigh |
 |
|---|
| ArgC MShigh |
 |
|---|
| LysN MShigh |
 |
|---|
| TryLysC MShigh |
 |
|---|
General Statistics
Number of major isoforms |
Number of additional isoforms |
Number of all proteins |
Number of amino acids |
Min. Seq. Length |
Max. Seq. Length |
Avg. Seq. Length |
Avg. Mol. Weight |
|---|---|---|---|---|---|---|---|
0 |
1561054 |
24 |
10442 |
309.9 |
33.57 |
Amino acid frequency
Ala |
Cys |
Asp |
Glu |
Phe |
Gly |
His |
Ile |
Lys |
Leu |
|---|---|---|---|---|---|---|---|---|---|
12.638 ± 0.049 | 0.905 ± 0.013 |
5.865 ± 0.035 | 6.194 ± 0.03 |
3.762 ± 0.023 | 8.83 ± 0.043 |
2.001 ± 0.018 | 5.116 ± 0.025 |
2.702 ± 0.03 | 10.229 ± 0.045 |
Met |
Asn |
Gln |
Pro |
Arg |
Ser |
Thr |
Val |
Trp |
Tyr |
|---|---|---|---|---|---|---|---|---|---|
2.648 ± 0.022 | 2.401 ± 0.022 |
5.247 ± 0.032 | 2.779 ± 0.015 |
7.174 ± 0.046 | 5.245 ± 0.032 |
5.345 ± 0.032 | 7.369 ± 0.03 |
1.41 ± 0.016 | 2.142 ± 0.019 |
Most of the basic statistics you can see at this page can be downloaded from this CSV file
Proteome-pI is available under Creative Commons Attribution-NoDerivs license, for more details see here
| Reference: Kozlowski LP. Proteome-pI 2.0: Proteome Isoelectric Point Database Update. Nucleic Acids Res. 2021, doi: 10.1093/nar/gkab944 | Contact: Lukasz P. Kozlowski |
