Thermoplasmatales archaeon I-plasma
Taxonomy: cellular organisms; Archaea; Candidatus Thermoplasmatota; Thermoplasmata; Thermoplasmatales; unclassified Thermoplasmatales
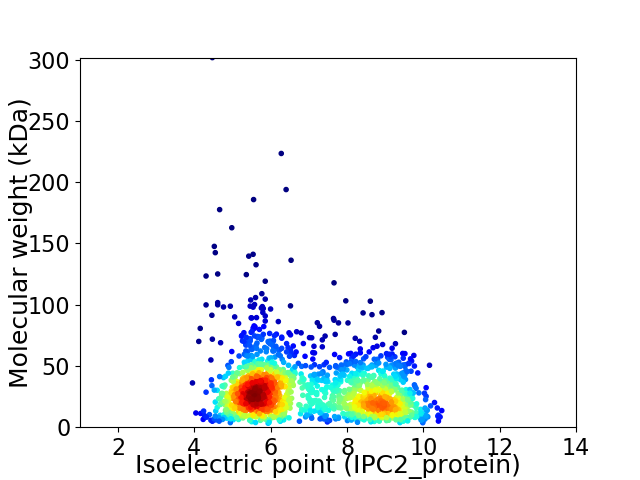
Average proteome isoelectric point is 6.92
Get precalculated fractions of proteins

Virtual 2D-PAGE plot for 1693 proteins (isoelectric point calculated using IPC2_protein)
Get csv file with sequences according to given criteria:
* You can choose from 21 different methods for calculating isoelectric point
Summary statistics related to proteome-wise predictions


Protein with the lowest isoelectric point:
>tr|T0LAW9|T0LAW9_9ARCH DLH domain-containing protein OS=Thermoplasmatales archaeon I-plasma OX=667138 GN=AMDU3_IPLC00004G0540 PE=4 SV=1
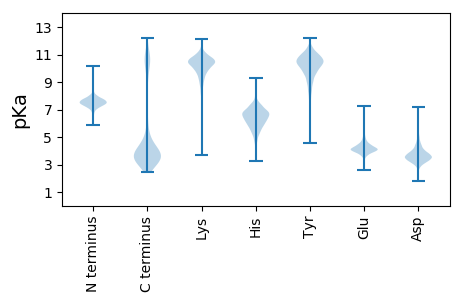
MM1 pKa = 7.49NNRR4 pKa = 11.84LKK6 pKa = 10.52IVIAVVVVLAVVVGGFVIYY25 pKa = 10.8HH26 pKa = 6.7EE27 pKa = 4.98DD28 pKa = 3.31ATGKK32 pKa = 10.59AKK34 pKa = 11.02GEE36 pKa = 4.3IITITTGDD44 pKa = 4.02NIPYY48 pKa = 9.58KK49 pKa = 9.63LTRR52 pKa = 11.84IVSLDD57 pKa = 3.42PAATATIYY65 pKa = 11.39ALGAYY70 pKa = 9.57NDD72 pKa = 4.07LVGGNSYY79 pKa = 11.41DD80 pKa = 3.65FYY82 pKa = 10.9PPNEE86 pKa = 4.04NLPNVTDD93 pKa = 3.98YY94 pKa = 11.57PSMDD98 pKa = 3.53LEE100 pKa = 4.71QIFNLSADD108 pKa = 3.62AVISFSNYY116 pKa = 9.38SGAQISQLLNSGINYY131 pKa = 9.13VFLSSDD137 pKa = 2.93AGVNFSVIEE146 pKa = 4.06KK147 pKa = 10.55QNTLLGEE154 pKa = 4.26LTGTVANATLINQWMNVSLSTLHH177 pKa = 7.09EE178 pKa = 4.71DD179 pKa = 3.63ALSYY183 pKa = 10.74DD184 pKa = 3.2QSEE187 pKa = 4.82YY188 pKa = 11.29NGTPLRR194 pKa = 11.84GFYY197 pKa = 10.53YY198 pKa = 10.19LSSYY202 pKa = 9.44GGYY205 pKa = 6.6WTAGNDD211 pKa = 3.56TFVNSYY217 pKa = 9.26FQYY220 pKa = 11.62ADD222 pKa = 3.92IINIAAPYY230 pKa = 10.44DD231 pKa = 3.55SGFYY235 pKa = 10.07TINPEE240 pKa = 4.21NIVNEE245 pKa = 4.2SPQIVILDD253 pKa = 3.72DD254 pKa = 4.54SINASSLNATGSPFASSPAVMNGKK278 pKa = 9.99VYY280 pKa = 7.61TTTSNEE286 pKa = 4.08YY287 pKa = 10.02MFTEE291 pKa = 4.43PNFRR295 pKa = 11.84DD296 pKa = 2.97IFAIQWIIFMVYY308 pKa = 9.37GQNPALPSFPINLTYY323 pKa = 10.86NPNPNGVSS331 pKa = 3.2
MM1 pKa = 7.49NNRR4 pKa = 11.84LKK6 pKa = 10.52IVIAVVVVLAVVVGGFVIYY25 pKa = 10.8HH26 pKa = 6.7EE27 pKa = 4.98DD28 pKa = 3.31ATGKK32 pKa = 10.59AKK34 pKa = 11.02GEE36 pKa = 4.3IITITTGDD44 pKa = 4.02NIPYY48 pKa = 9.58KK49 pKa = 9.63LTRR52 pKa = 11.84IVSLDD57 pKa = 3.42PAATATIYY65 pKa = 11.39ALGAYY70 pKa = 9.57NDD72 pKa = 4.07LVGGNSYY79 pKa = 11.41DD80 pKa = 3.65FYY82 pKa = 10.9PPNEE86 pKa = 4.04NLPNVTDD93 pKa = 3.98YY94 pKa = 11.57PSMDD98 pKa = 3.53LEE100 pKa = 4.71QIFNLSADD108 pKa = 3.62AVISFSNYY116 pKa = 9.38SGAQISQLLNSGINYY131 pKa = 9.13VFLSSDD137 pKa = 2.93AGVNFSVIEE146 pKa = 4.06KK147 pKa = 10.55QNTLLGEE154 pKa = 4.26LTGTVANATLINQWMNVSLSTLHH177 pKa = 7.09EE178 pKa = 4.71DD179 pKa = 3.63ALSYY183 pKa = 10.74DD184 pKa = 3.2QSEE187 pKa = 4.82YY188 pKa = 11.29NGTPLRR194 pKa = 11.84GFYY197 pKa = 10.53YY198 pKa = 10.19LSSYY202 pKa = 9.44GGYY205 pKa = 6.6WTAGNDD211 pKa = 3.56TFVNSYY217 pKa = 9.26FQYY220 pKa = 11.62ADD222 pKa = 3.92IINIAAPYY230 pKa = 10.44DD231 pKa = 3.55SGFYY235 pKa = 10.07TINPEE240 pKa = 4.21NIVNEE245 pKa = 4.2SPQIVILDD253 pKa = 3.72DD254 pKa = 4.54SINASSLNATGSPFASSPAVMNGKK278 pKa = 9.99VYY280 pKa = 7.61TTTSNEE286 pKa = 4.08YY287 pKa = 10.02MFTEE291 pKa = 4.43PNFRR295 pKa = 11.84DD296 pKa = 2.97IFAIQWIIFMVYY308 pKa = 9.37GQNPALPSFPINLTYY323 pKa = 10.86NPNPNGVSS331 pKa = 3.2
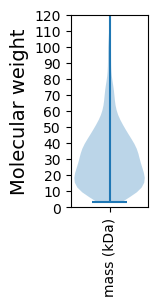
Molecular weight: 36.13 kDa
Isoelectric point according different methods:
Protein with the highest isoelectric point:
>tr|T0LDE3|T0LDE3_9ARCH Thioesterase superfamily protein OS=Thermoplasmatales archaeon I-plasma OX=667138 GN=AMDU3_IPLC00001G0043 PE=3 SV=1
MM1 pKa = 7.52SYY3 pKa = 10.52HH4 pKa = 5.3YY5 pKa = 10.51VRR7 pKa = 11.84NILRR11 pKa = 11.84QIGARR16 pKa = 11.84GGVPRR21 pKa = 11.84FHH23 pKa = 6.91AHH25 pKa = 7.64AARR28 pKa = 11.84LWCATALLRR37 pKa = 11.84GIFGQKK43 pKa = 9.8PLDD46 pKa = 3.29IRR48 pKa = 11.84MVQIHH53 pKa = 7.43LDD55 pKa = 3.41HH56 pKa = 7.19KK57 pKa = 10.96SPKK60 pKa = 6.78TTQRR64 pKa = 11.84YY65 pKa = 4.94THH67 pKa = 5.39VCRR70 pKa = 11.84LEE72 pKa = 4.04VSDD75 pKa = 4.4
MM1 pKa = 7.52SYY3 pKa = 10.52HH4 pKa = 5.3YY5 pKa = 10.51VRR7 pKa = 11.84NILRR11 pKa = 11.84QIGARR16 pKa = 11.84GGVPRR21 pKa = 11.84FHH23 pKa = 6.91AHH25 pKa = 7.64AARR28 pKa = 11.84LWCATALLRR37 pKa = 11.84GIFGQKK43 pKa = 9.8PLDD46 pKa = 3.29IRR48 pKa = 11.84MVQIHH53 pKa = 7.43LDD55 pKa = 3.41HH56 pKa = 7.19KK57 pKa = 10.96SPKK60 pKa = 6.78TTQRR64 pKa = 11.84YY65 pKa = 4.94THH67 pKa = 5.39VCRR70 pKa = 11.84LEE72 pKa = 4.04VSDD75 pKa = 4.4
Molecular weight: 8.69 kDa
Isoelectric point according different methods:
Peptides (in silico digests for buttom-up proteomics)
Below you can find in silico digests of the whole proteome with Trypsin, Chymotrypsin, Trypsin+LysC, LysN, ArgC proteases suitable for different mass spec machines.| Try ESI |
 |
|---|
| ChTry ESI |
 |
|---|
| ArgC ESI |
 |
|---|
| LysN ESI |
 |
|---|
| TryLysC ESI |
 |
|---|
| Try MALDI |
 |
|---|
| ChTry MALDI |
 |
|---|
| ArgC MALDI |
 |
|---|
| LysN MALDI |
 |
|---|
| TryLysC MALDI |
 |
|---|
| Try LTQ |
 |
|---|
| ChTry LTQ |
 |
|---|
| ArgC LTQ |
 |
|---|
| LysN LTQ |
 |
|---|
| TryLysC LTQ |
 |
|---|
| Try MSlow |
 |
|---|
| ChTry MSlow |
 |
|---|
| ArgC MSlow |
 |
|---|
| LysN MSlow |
 |
|---|
| TryLysC MSlow |
 |
|---|
| Try MShigh |
 |
|---|
| ChTry MShigh |
 |
|---|
| ArgC MShigh |
 |
|---|
| LysN MShigh |
 |
|---|
| TryLysC MShigh |
 |
|---|
General Statistics
Number of major isoforms |
Number of additional isoforms |
Number of all proteins |
Number of amino acids |
Min. Seq. Length |
Max. Seq. Length |
Avg. Seq. Length |
Avg. Mol. Weight |
|---|---|---|---|---|---|---|---|
0 |
492143 |
31 |
2927 |
290.7 |
32.5 |
Amino acid frequency
Ala |
Cys |
Asp |
Glu |
Phe |
Gly |
His |
Ile |
Lys |
Leu |
|---|---|---|---|---|---|---|---|---|---|
6.203 ± 0.051 | 0.578 ± 0.016 |
5.038 ± 0.055 | 6.694 ± 0.08 |
4.731 ± 0.04 | 7.608 ± 0.052 |
1.461 ± 0.021 | 8.132 ± 0.05 |
6.746 ± 0.077 | 9.101 ± 0.07 |
Met |
Asn |
Gln |
Pro |
Arg |
Ser |
Thr |
Val |
Trp |
Tyr |
|---|---|---|---|---|---|---|---|---|---|
2.702 ± 0.031 | 4.48 ± 0.05 |
3.886 ± 0.039 | 2.282 ± 0.032 |
5.1 ± 0.063 | 7.821 ± 0.103 |
5.207 ± 0.099 | 7.371 ± 0.052 |
0.917 ± 0.021 | 3.941 ± 0.044 |
Most of the basic statistics you can see at this page can be downloaded from this CSV file
Proteome-pI is available under Creative Commons Attribution-NoDerivs license, for more details see here
| Reference: Kozlowski LP. Proteome-pI 2.0: Proteome Isoelectric Point Database Update. Nucleic Acids Res. 2021, doi: 10.1093/nar/gkab944 | Contact: Lukasz P. Kozlowski |
