Arthrobacter sp. AQ5-06
Taxonomy: cellular organisms; Bacteria; Terrabacteria group; Actinobacteria; Actinomycetia; Micrococcales; Micrococcaceae; Arthrobacter; unclassified Arthrobacter
Average proteome isoelectric point is 6.21
Get precalculated fractions of proteins

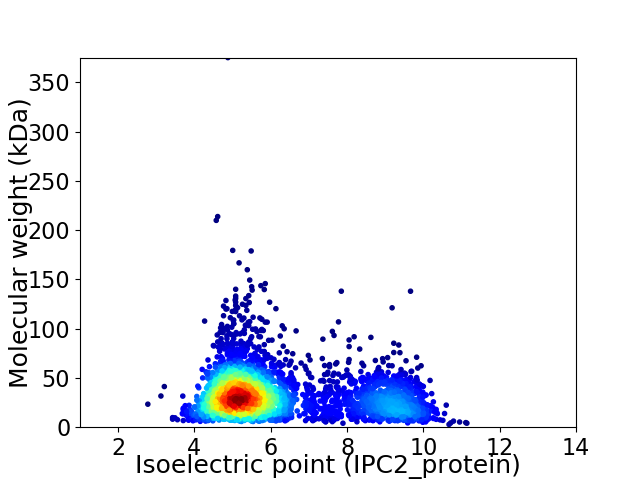
Virtual 2D-PAGE plot for 3663 proteins (isoelectric point calculated using IPC2_protein)
Get csv file with sequences according to given criteria:
* You can choose from 21 different methods for calculating isoelectric point
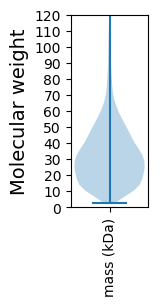
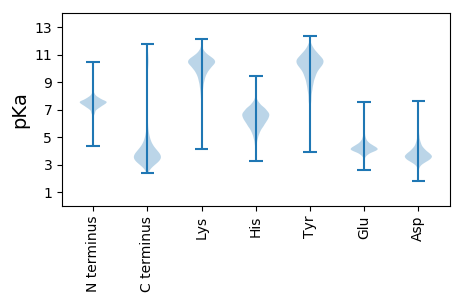
Summary statistics related to proteome-wise predictions


Protein with the lowest isoelectric point:
>tr|A0A329YWA5|A0A329YWA5_9MICC Dioxygenase OS=Arthrobacter sp. AQ5-06 OX=1914304 GN=DQ354_05900 PE=4 SV=1
MM1 pKa = 7.26SRR3 pKa = 11.84ALIIVDD9 pKa = 3.67VQNDD13 pKa = 3.63FCEE16 pKa = 4.88GGSLAVAGGADD27 pKa = 3.35VAGAISEE34 pKa = 4.4YY35 pKa = 11.07VDD37 pKa = 3.12AHH39 pKa = 6.32HH40 pKa = 7.08NEE42 pKa = 3.83FDD44 pKa = 4.95HH45 pKa = 7.69IVATQDD51 pKa = 2.79WHH53 pKa = 6.82IDD55 pKa = 3.55PGAHH59 pKa = 7.19FSDD62 pKa = 4.03TPDD65 pKa = 5.22LKK67 pKa = 11.15DD68 pKa = 2.99SWPRR72 pKa = 11.84HH73 pKa = 5.09CVAGTRR79 pKa = 11.84GAEE82 pKa = 3.94LHH84 pKa = 7.04PDD86 pKa = 3.53LDD88 pKa = 3.77TEE90 pKa = 4.48YY91 pKa = 10.49IQAYY95 pKa = 5.92FQKK98 pKa = 10.57GQFAAAYY105 pKa = 9.64SGFEE109 pKa = 3.96GLLAPEE115 pKa = 4.76DD116 pKa = 3.76AVPTGEE122 pKa = 4.18RR123 pKa = 11.84QPGAMPADD131 pKa = 3.82ADD133 pKa = 3.94AYY135 pKa = 10.75APADD139 pKa = 3.68NAIGLDD145 pKa = 3.67DD146 pKa = 4.2WLQSHH151 pKa = 6.64DD152 pKa = 3.82VEE154 pKa = 4.63DD155 pKa = 4.06VVVVGIATDD164 pKa = 3.76YY165 pKa = 11.34CVMATSLDD173 pKa = 3.78AVQAGYY179 pKa = 10.47SVTVIRR185 pKa = 11.84SLTAGIAEE193 pKa = 4.39DD194 pKa = 4.94LEE196 pKa = 4.53DD197 pKa = 4.4AVAEE201 pKa = 4.13MEE203 pKa = 4.3LGGVEE208 pKa = 4.36VAA210 pKa = 5.23
MM1 pKa = 7.26SRR3 pKa = 11.84ALIIVDD9 pKa = 3.67VQNDD13 pKa = 3.63FCEE16 pKa = 4.88GGSLAVAGGADD27 pKa = 3.35VAGAISEE34 pKa = 4.4YY35 pKa = 11.07VDD37 pKa = 3.12AHH39 pKa = 6.32HH40 pKa = 7.08NEE42 pKa = 3.83FDD44 pKa = 4.95HH45 pKa = 7.69IVATQDD51 pKa = 2.79WHH53 pKa = 6.82IDD55 pKa = 3.55PGAHH59 pKa = 7.19FSDD62 pKa = 4.03TPDD65 pKa = 5.22LKK67 pKa = 11.15DD68 pKa = 2.99SWPRR72 pKa = 11.84HH73 pKa = 5.09CVAGTRR79 pKa = 11.84GAEE82 pKa = 3.94LHH84 pKa = 7.04PDD86 pKa = 3.53LDD88 pKa = 3.77TEE90 pKa = 4.48YY91 pKa = 10.49IQAYY95 pKa = 5.92FQKK98 pKa = 10.57GQFAAAYY105 pKa = 9.64SGFEE109 pKa = 3.96GLLAPEE115 pKa = 4.76DD116 pKa = 3.76AVPTGEE122 pKa = 4.18RR123 pKa = 11.84QPGAMPADD131 pKa = 3.82ADD133 pKa = 3.94AYY135 pKa = 10.75APADD139 pKa = 3.68NAIGLDD145 pKa = 3.67DD146 pKa = 4.2WLQSHH151 pKa = 6.64DD152 pKa = 3.82VEE154 pKa = 4.63DD155 pKa = 4.06VVVVGIATDD164 pKa = 3.76YY165 pKa = 11.34CVMATSLDD173 pKa = 3.78AVQAGYY179 pKa = 10.47SVTVIRR185 pKa = 11.84SLTAGIAEE193 pKa = 4.39DD194 pKa = 4.94LEE196 pKa = 4.53DD197 pKa = 4.4AVAEE201 pKa = 4.13MEE203 pKa = 4.3LGGVEE208 pKa = 4.36VAA210 pKa = 5.23
Molecular weight: 22.18 kDa
Isoelectric point according different methods:
Protein with the highest isoelectric point:
>tr|A0A329YNQ4|A0A329YNQ4_9MICC Threonine/serine exporter family protein OS=Arthrobacter sp. AQ5-06 OX=1914304 GN=DQ354_12960 PE=4 SV=1
MM1 pKa = 7.61KK2 pKa = 10.31VRR4 pKa = 11.84NSLRR8 pKa = 11.84ALKK11 pKa = 9.72KK12 pKa = 10.42VPGAQIVRR20 pKa = 11.84RR21 pKa = 11.84RR22 pKa = 11.84GRR24 pKa = 11.84TFVINKK30 pKa = 9.03KK31 pKa = 8.56NPRR34 pKa = 11.84MKK36 pKa = 10.47ARR38 pKa = 11.84QGG40 pKa = 3.24
MM1 pKa = 7.61KK2 pKa = 10.31VRR4 pKa = 11.84NSLRR8 pKa = 11.84ALKK11 pKa = 9.72KK12 pKa = 10.42VPGAQIVRR20 pKa = 11.84RR21 pKa = 11.84RR22 pKa = 11.84GRR24 pKa = 11.84TFVINKK30 pKa = 9.03KK31 pKa = 8.56NPRR34 pKa = 11.84MKK36 pKa = 10.47ARR38 pKa = 11.84QGG40 pKa = 3.24
Molecular weight: 4.66 kDa
Isoelectric point according different methods:
Peptides (in silico digests for buttom-up proteomics)
Below you can find in silico digests of the whole proteome with Trypsin, Chymotrypsin, Trypsin+LysC, LysN, ArgC proteases suitable for different mass spec machines.| Try ESI |
 |
|---|
| ChTry ESI |
 |
|---|
| ArgC ESI |
 |
|---|
| LysN ESI |
 |
|---|
| TryLysC ESI |
 |
|---|
| Try MALDI |
 |
|---|
| ChTry MALDI |
 |
|---|
| ArgC MALDI |
 |
|---|
| LysN MALDI |
 |
|---|
| TryLysC MALDI |
 |
|---|
| Try LTQ |
 |
|---|
| ChTry LTQ |
 |
|---|
| ArgC LTQ |
 |
|---|
| LysN LTQ |
 |
|---|
| TryLysC LTQ |
 |
|---|
| Try MSlow |
 |
|---|
| ChTry MSlow |
 |
|---|
| ArgC MSlow |
 |
|---|
| LysN MSlow |
 |
|---|
| TryLysC MSlow |
 |
|---|
| Try MShigh |
 |
|---|
| ChTry MShigh |
 |
|---|
| ArgC MShigh |
 |
|---|
| LysN MShigh |
 |
|---|
| TryLysC MShigh |
 |
|---|
General Statistics
Number of major isoforms |
Number of additional isoforms |
Number of all proteins |
Number of amino acids |
Min. Seq. Length |
Max. Seq. Length |
Avg. Seq. Length |
Avg. Mol. Weight |
|---|---|---|---|---|---|---|---|
0 |
1169135 |
24 |
3558 |
319.2 |
34.15 |
Amino acid frequency
Ala |
Cys |
Asp |
Glu |
Phe |
Gly |
His |
Ile |
Lys |
Leu |
|---|---|---|---|---|---|---|---|---|---|
13.029 ± 0.056 | 0.628 ± 0.011 |
5.642 ± 0.036 | 5.544 ± 0.037 |
3.225 ± 0.027 | 9.081 ± 0.035 |
2.099 ± 0.02 | 4.408 ± 0.031 |
2.821 ± 0.03 | 10.24 ± 0.046 |
Met |
Asn |
Gln |
Pro |
Arg |
Ser |
Thr |
Val |
Trp |
Tyr |
|---|---|---|---|---|---|---|---|---|---|
2.042 ± 0.017 | 2.523 ± 0.026 |
5.425 ± 0.033 | 3.174 ± 0.022 |
6.427 ± 0.038 | 5.948 ± 0.028 |
5.91 ± 0.031 | 8.357 ± 0.036 |
1.408 ± 0.02 | 2.07 ± 0.019 |
Most of the basic statistics you can see at this page can be downloaded from this CSV file
Proteome-pI is available under Creative Commons Attribution-NoDerivs license, for more details see here
| Reference: Kozlowski LP. Proteome-pI 2.0: Proteome Isoelectric Point Database Update. Nucleic Acids Res. 2021, doi: 10.1093/nar/gkab944 | Contact: Lukasz P. Kozlowski |
