Muribaculaceae bacterium Isolate-080 (Janvier)
Taxonomy: cellular organisms; Bacteria; FCB group; Bacteroidetes/Chlorobi group; Bacteroidetes; Bacteroidia; Bacteroidales; Muribaculaceae; unclassified Muribaculaceae
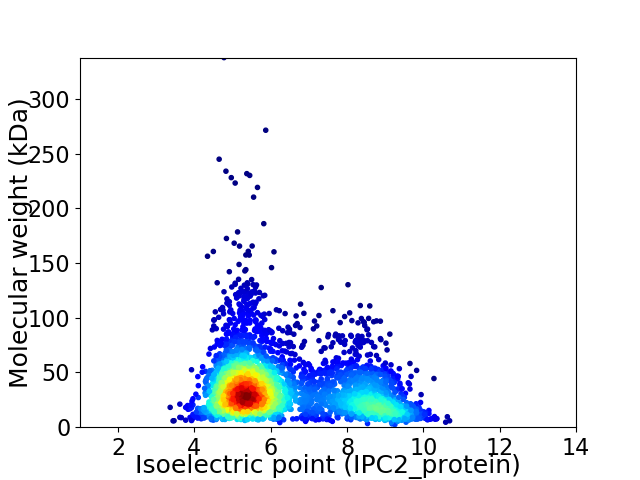
Average proteome isoelectric point is 6.34
Get precalculated fractions of proteins

Virtual 2D-PAGE plot for 3287 proteins (isoelectric point calculated using IPC2_protein)
Get csv file with sequences according to given criteria:
* You can choose from 21 different methods for calculating isoelectric point
Summary statistics related to proteome-wise predictions


Protein with the lowest isoelectric point:
>tr|A0A3N2KZQ2|A0A3N2KZQ2_9BACT DUF5063 domain-containing protein OS=Muribaculaceae bacterium Isolate-080 (Janvier) OX=2486468 GN=EEL39_01620 PE=4 SV=1
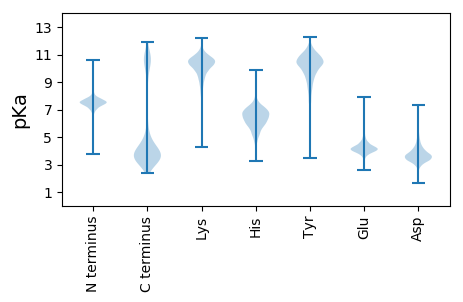
MM1 pKa = 7.41EE2 pKa = 6.19LSPNSLAFIALCNEE16 pKa = 4.02FCYY19 pKa = 10.37AVEE22 pKa = 4.11NARR25 pKa = 11.84EE26 pKa = 4.16STRR29 pKa = 11.84NAFVASMLRR38 pKa = 11.84LLPRR42 pKa = 11.84IYY44 pKa = 10.35ISASDD49 pKa = 4.61LKK51 pKa = 10.68PEE53 pKa = 4.13PLIDD57 pKa = 4.05EE58 pKa = 4.71DD59 pKa = 3.91DD60 pKa = 4.32AYY62 pKa = 10.17IEE64 pKa = 4.41SFLDD68 pKa = 3.15EE69 pKa = 5.34DD70 pKa = 4.73YY71 pKa = 10.97YY72 pKa = 11.35EE73 pKa = 4.48SMRR76 pKa = 11.84RR77 pKa = 11.84QIEE80 pKa = 4.18NLLGADD86 pKa = 3.67DD87 pKa = 4.51VYY89 pKa = 11.77LEE91 pKa = 4.23VFEE94 pKa = 5.74EE95 pKa = 4.05DD96 pKa = 3.32MKK98 pKa = 11.72YY99 pKa = 10.84SDD101 pKa = 4.15TPIGMSVAEE110 pKa = 4.92GICDD114 pKa = 3.6VFQVLYY120 pKa = 11.06NFIVTVKK127 pKa = 9.88DD128 pKa = 3.5APSEE132 pKa = 4.28VVNAALTAVRR142 pKa = 11.84DD143 pKa = 4.01DD144 pKa = 4.42FGSYY148 pKa = 7.94WSQRR152 pKa = 11.84VCNLMRR158 pKa = 11.84PLNHH162 pKa = 7.02LFYY165 pKa = 11.14SSDD168 pKa = 3.58NDD170 pKa = 4.21DD171 pKa = 4.75DD172 pKa = 6.15DD173 pKa = 5.86NII175 pKa = 4.89
MM1 pKa = 7.41EE2 pKa = 6.19LSPNSLAFIALCNEE16 pKa = 4.02FCYY19 pKa = 10.37AVEE22 pKa = 4.11NARR25 pKa = 11.84EE26 pKa = 4.16STRR29 pKa = 11.84NAFVASMLRR38 pKa = 11.84LLPRR42 pKa = 11.84IYY44 pKa = 10.35ISASDD49 pKa = 4.61LKK51 pKa = 10.68PEE53 pKa = 4.13PLIDD57 pKa = 4.05EE58 pKa = 4.71DD59 pKa = 3.91DD60 pKa = 4.32AYY62 pKa = 10.17IEE64 pKa = 4.41SFLDD68 pKa = 3.15EE69 pKa = 5.34DD70 pKa = 4.73YY71 pKa = 10.97YY72 pKa = 11.35EE73 pKa = 4.48SMRR76 pKa = 11.84RR77 pKa = 11.84QIEE80 pKa = 4.18NLLGADD86 pKa = 3.67DD87 pKa = 4.51VYY89 pKa = 11.77LEE91 pKa = 4.23VFEE94 pKa = 5.74EE95 pKa = 4.05DD96 pKa = 3.32MKK98 pKa = 11.72YY99 pKa = 10.84SDD101 pKa = 4.15TPIGMSVAEE110 pKa = 4.92GICDD114 pKa = 3.6VFQVLYY120 pKa = 11.06NFIVTVKK127 pKa = 9.88DD128 pKa = 3.5APSEE132 pKa = 4.28VVNAALTAVRR142 pKa = 11.84DD143 pKa = 4.01DD144 pKa = 4.42FGSYY148 pKa = 7.94WSQRR152 pKa = 11.84VCNLMRR158 pKa = 11.84PLNHH162 pKa = 7.02LFYY165 pKa = 11.14SSDD168 pKa = 3.58NDD170 pKa = 4.21DD171 pKa = 4.75DD172 pKa = 6.15DD173 pKa = 5.86NII175 pKa = 4.89
Molecular weight: 20.01 kDa
Isoelectric point according different methods:
Protein with the highest isoelectric point:
>tr|A0A3N2KJY6|A0A3N2KJY6_9BACT Uncharacterized protein OS=Muribaculaceae bacterium Isolate-080 (Janvier) OX=2486468 GN=EEL39_14570 PE=4 SV=1
MM1 pKa = 7.32KK2 pKa = 10.4AEE4 pKa = 4.12LSIVITFIFSLFFWFLRR21 pKa = 11.84QNSAINQRR29 pKa = 11.84GFNSSLRR36 pKa = 11.84GSRR39 pKa = 11.84KK40 pKa = 9.07IFMDD44 pKa = 3.45NGSVTRR50 pKa = 11.84TDD52 pKa = 3.55GATSCLLAGNGACSWRR68 pKa = 11.84LRR70 pKa = 11.84YY71 pKa = 9.9LCGKK75 pKa = 9.6LL76 pKa = 3.39
MM1 pKa = 7.32KK2 pKa = 10.4AEE4 pKa = 4.12LSIVITFIFSLFFWFLRR21 pKa = 11.84QNSAINQRR29 pKa = 11.84GFNSSLRR36 pKa = 11.84GSRR39 pKa = 11.84KK40 pKa = 9.07IFMDD44 pKa = 3.45NGSVTRR50 pKa = 11.84TDD52 pKa = 3.55GATSCLLAGNGACSWRR68 pKa = 11.84LRR70 pKa = 11.84YY71 pKa = 9.9LCGKK75 pKa = 9.6LL76 pKa = 3.39
Molecular weight: 8.54 kDa
Isoelectric point according different methods:
Peptides (in silico digests for buttom-up proteomics)
Below you can find in silico digests of the whole proteome with Trypsin, Chymotrypsin, Trypsin+LysC, LysN, ArgC proteases suitable for different mass spec machines.| Try ESI |
 |
|---|
| ChTry ESI |
 |
|---|
| ArgC ESI |
 |
|---|
| LysN ESI |
 |
|---|
| TryLysC ESI |
 |
|---|
| Try MALDI |
 |
|---|
| ChTry MALDI |
 |
|---|
| ArgC MALDI |
 |
|---|
| LysN MALDI |
 |
|---|
| TryLysC MALDI |
 |
|---|
| Try LTQ |
 |
|---|
| ChTry LTQ |
 |
|---|
| ArgC LTQ |
 |
|---|
| LysN LTQ |
 |
|---|
| TryLysC LTQ |
 |
|---|
| Try MSlow |
 |
|---|
| ChTry MSlow |
 |
|---|
| ArgC MSlow |
 |
|---|
| LysN MSlow |
 |
|---|
| TryLysC MSlow |
 |
|---|
| Try MShigh |
 |
|---|
| ChTry MShigh |
 |
|---|
| ArgC MShigh |
 |
|---|
| LysN MShigh |
 |
|---|
| TryLysC MShigh |
 |
|---|
General Statistics
Number of major isoforms |
Number of additional isoforms |
Number of all proteins |
Number of amino acids |
Min. Seq. Length |
Max. Seq. Length |
Avg. Seq. Length |
Avg. Mol. Weight |
|---|---|---|---|---|---|---|---|
0 |
1130632 |
23 |
3087 |
344.0 |
38.57 |
Amino acid frequency
Ala |
Cys |
Asp |
Glu |
Phe |
Gly |
His |
Ile |
Lys |
Leu |
|---|---|---|---|---|---|---|---|---|---|
7.703 ± 0.036 | 1.234 ± 0.018 |
6.096 ± 0.029 | 6.272 ± 0.041 |
4.296 ± 0.027 | 6.904 ± 0.04 |
1.896 ± 0.019 | 6.984 ± 0.04 |
5.782 ± 0.039 | 8.675 ± 0.049 |
Met |
Asn |
Gln |
Pro |
Arg |
Ser |
Thr |
Val |
Trp |
Tyr |
|---|---|---|---|---|---|---|---|---|---|
2.753 ± 0.018 | 4.914 ± 0.031 |
4.063 ± 0.027 | 2.91 ± 0.026 |
5.417 ± 0.036 | 6.615 ± 0.035 |
5.733 ± 0.03 | 6.467 ± 0.039 |
1.211 ± 0.019 | 4.074 ± 0.034 |
Most of the basic statistics you can see at this page can be downloaded from this CSV file
Proteome-pI is available under Creative Commons Attribution-NoDerivs license, for more details see here
| Reference: Kozlowski LP. Proteome-pI 2.0: Proteome Isoelectric Point Database Update. Nucleic Acids Res. 2021, doi: 10.1093/nar/gkab944 | Contact: Lukasz P. Kozlowski |
