Flavobacterium macacae
Taxonomy: cellular organisms; Bacteria; FCB group; Bacteroidetes/Chlorobi group; Bacteroidetes; Flavobacteriia; Flavobacteriales; Flavobacteriaceae; Flavobacterium
Average proteome isoelectric point is 6.51
Get precalculated fractions of proteins

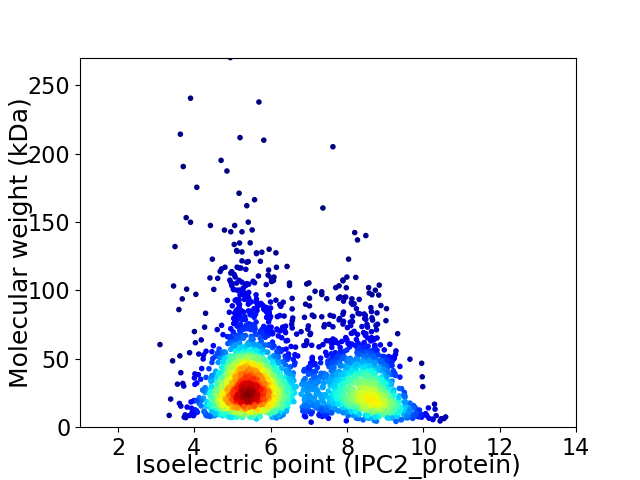
Virtual 2D-PAGE plot for 3009 proteins (isoelectric point calculated using IPC2_protein)
Get csv file with sequences according to given criteria:
* You can choose from 21 different methods for calculating isoelectric point
Summary statistics related to proteome-wise predictions


Protein with the lowest isoelectric point:
>tr|A0A3P3WJN9|A0A3P3WJN9_9FLAO XRE family transcriptional regulator OS=Flavobacterium macacae OX=2488993 GN=EG849_05450 PE=4 SV=1
MM1 pKa = 7.49KK2 pKa = 10.36KK3 pKa = 10.47VILSVAFMLATGVAFAQEE21 pKa = 3.79NSATVSQEE29 pKa = 3.51GTSNGSSVVQVGRR42 pKa = 11.84EE43 pKa = 3.71NTATVNQQGNVAPGVASGLEE63 pKa = 3.83NSSIVDD69 pKa = 3.41QLGDD73 pKa = 3.46EE74 pKa = 4.33NMADD78 pKa = 3.18VDD80 pKa = 3.91QRR82 pKa = 11.84GDD84 pKa = 3.64FNISDD89 pKa = 3.89VNQDD93 pKa = 2.92GDD95 pKa = 3.95NNEE98 pKa = 4.05ATVSQGNGGGQAEE111 pKa = 4.35NNKK114 pKa = 10.27AYY116 pKa = 8.44ATQLGDD122 pKa = 3.9GNKK125 pKa = 8.66STQTQRR131 pKa = 11.84FDD133 pKa = 3.75NNTGTVTQTGDD144 pKa = 3.83DD145 pKa = 3.57NVATQFQTSGPDD157 pKa = 3.38GSAGNTATATQHH169 pKa = 6.5GDD171 pKa = 3.14GNEE174 pKa = 3.6VDD176 pKa = 3.97QRR178 pKa = 11.84QEE180 pKa = 3.86GHH182 pKa = 6.53SNTALATQGINPSSFQALNNYY203 pKa = 9.02ALQDD207 pKa = 3.45QDD209 pKa = 3.91GDD211 pKa = 4.36SNNAMISQSNQDD223 pKa = 3.34NEE225 pKa = 4.23AYY227 pKa = 9.95QYY229 pKa = 11.11QIGDD233 pKa = 4.06SNSATVWQDD242 pKa = 3.05EE243 pKa = 4.43VQPTINGGDD252 pKa = 3.76LAVQYY257 pKa = 10.82QEE259 pKa = 4.58GDD261 pKa = 3.76SNAATIDD268 pKa = 3.14QGEE271 pKa = 4.45NYY273 pKa = 10.47LGAPYY278 pKa = 10.14NAYY281 pKa = 9.26PHH283 pKa = 7.12GDD285 pKa = 3.4NEE287 pKa = 4.71SYY289 pKa = 10.45QVQLGDD295 pKa = 4.93DD296 pKa = 3.97NIAYY300 pKa = 9.74SKK302 pKa = 11.01QSGTSNISGQLQMGEE317 pKa = 4.43GNNANHH323 pKa = 5.62VQVGNSNVAATYY335 pKa = 10.83QNGEE339 pKa = 4.65DD340 pKa = 3.62NTSSIDD346 pKa = 3.81QLGLGNGALTIQMGDD361 pKa = 2.98GHH363 pKa = 6.75MSTVTQVGNTNVSFVSQSNN382 pKa = 3.16
MM1 pKa = 7.49KK2 pKa = 10.36KK3 pKa = 10.47VILSVAFMLATGVAFAQEE21 pKa = 3.79NSATVSQEE29 pKa = 3.51GTSNGSSVVQVGRR42 pKa = 11.84EE43 pKa = 3.71NTATVNQQGNVAPGVASGLEE63 pKa = 3.83NSSIVDD69 pKa = 3.41QLGDD73 pKa = 3.46EE74 pKa = 4.33NMADD78 pKa = 3.18VDD80 pKa = 3.91QRR82 pKa = 11.84GDD84 pKa = 3.64FNISDD89 pKa = 3.89VNQDD93 pKa = 2.92GDD95 pKa = 3.95NNEE98 pKa = 4.05ATVSQGNGGGQAEE111 pKa = 4.35NNKK114 pKa = 10.27AYY116 pKa = 8.44ATQLGDD122 pKa = 3.9GNKK125 pKa = 8.66STQTQRR131 pKa = 11.84FDD133 pKa = 3.75NNTGTVTQTGDD144 pKa = 3.83DD145 pKa = 3.57NVATQFQTSGPDD157 pKa = 3.38GSAGNTATATQHH169 pKa = 6.5GDD171 pKa = 3.14GNEE174 pKa = 3.6VDD176 pKa = 3.97QRR178 pKa = 11.84QEE180 pKa = 3.86GHH182 pKa = 6.53SNTALATQGINPSSFQALNNYY203 pKa = 9.02ALQDD207 pKa = 3.45QDD209 pKa = 3.91GDD211 pKa = 4.36SNNAMISQSNQDD223 pKa = 3.34NEE225 pKa = 4.23AYY227 pKa = 9.95QYY229 pKa = 11.11QIGDD233 pKa = 4.06SNSATVWQDD242 pKa = 3.05EE243 pKa = 4.43VQPTINGGDD252 pKa = 3.76LAVQYY257 pKa = 10.82QEE259 pKa = 4.58GDD261 pKa = 3.76SNAATIDD268 pKa = 3.14QGEE271 pKa = 4.45NYY273 pKa = 10.47LGAPYY278 pKa = 10.14NAYY281 pKa = 9.26PHH283 pKa = 7.12GDD285 pKa = 3.4NEE287 pKa = 4.71SYY289 pKa = 10.45QVQLGDD295 pKa = 4.93DD296 pKa = 3.97NIAYY300 pKa = 9.74SKK302 pKa = 11.01QSGTSNISGQLQMGEE317 pKa = 4.43GNNANHH323 pKa = 5.62VQVGNSNVAATYY335 pKa = 10.83QNGEE339 pKa = 4.65DD340 pKa = 3.62NTSSIDD346 pKa = 3.81QLGLGNGALTIQMGDD361 pKa = 2.98GHH363 pKa = 6.75MSTVTQVGNTNVSFVSQSNN382 pKa = 3.16
Molecular weight: 39.83 kDa
Isoelectric point according different methods:
Protein with the highest isoelectric point:
>tr|A0A3P3W5L1|A0A3P3W5L1_9FLAO TonB-dependent receptor OS=Flavobacterium macacae OX=2488993 GN=EG849_10320 PE=4 SV=1
MM1 pKa = 7.47RR2 pKa = 11.84RR3 pKa = 11.84IAFAISAVGLAVSLYY18 pKa = 10.17ALPGRR23 pKa = 11.84FADD26 pKa = 3.84NSADD30 pKa = 3.44LTSYY34 pKa = 9.97ILKK37 pKa = 10.55GSFVLMFLVSLIINVICIHH56 pKa = 7.26DD57 pKa = 4.09YY58 pKa = 10.31FRR60 pKa = 11.84KK61 pKa = 9.79SKK63 pKa = 11.17NNIRR67 pKa = 11.84TIRR70 pKa = 11.84QYY72 pKa = 11.14YY73 pKa = 7.52LQRR76 pKa = 11.84SIRR79 pKa = 3.6
MM1 pKa = 7.47RR2 pKa = 11.84RR3 pKa = 11.84IAFAISAVGLAVSLYY18 pKa = 10.17ALPGRR23 pKa = 11.84FADD26 pKa = 3.84NSADD30 pKa = 3.44LTSYY34 pKa = 9.97ILKK37 pKa = 10.55GSFVLMFLVSLIINVICIHH56 pKa = 7.26DD57 pKa = 4.09YY58 pKa = 10.31FRR60 pKa = 11.84KK61 pKa = 9.79SKK63 pKa = 11.17NNIRR67 pKa = 11.84TIRR70 pKa = 11.84QYY72 pKa = 11.14YY73 pKa = 7.52LQRR76 pKa = 11.84SIRR79 pKa = 3.6
Molecular weight: 9.07 kDa
Isoelectric point according different methods:
Peptides (in silico digests for buttom-up proteomics)
Below you can find in silico digests of the whole proteome with Trypsin, Chymotrypsin, Trypsin+LysC, LysN, ArgC proteases suitable for different mass spec machines.| Try ESI |
 |
|---|
| ChTry ESI |
 |
|---|
| ArgC ESI |
 |
|---|
| LysN ESI |
 |
|---|
| TryLysC ESI |
 |
|---|
| Try MALDI |
 |
|---|
| ChTry MALDI |
 |
|---|
| ArgC MALDI |
 |
|---|
| LysN MALDI |
 |
|---|
| TryLysC MALDI |
 |
|---|
| Try LTQ |
 |
|---|
| ChTry LTQ |
 |
|---|
| ArgC LTQ |
 |
|---|
| LysN LTQ |
 |
|---|
| TryLysC LTQ |
 |
|---|
| Try MSlow |
 |
|---|
| ChTry MSlow |
 |
|---|
| ArgC MSlow |
 |
|---|
| LysN MSlow |
 |
|---|
| TryLysC MSlow |
 |
|---|
| Try MShigh |
 |
|---|
| ChTry MShigh |
 |
|---|
| ArgC MShigh |
 |
|---|
| LysN MShigh |
 |
|---|
| TryLysC MShigh |
 |
|---|
General Statistics
Number of major isoforms |
Number of additional isoforms |
Number of all proteins |
Number of amino acids |
Min. Seq. Length |
Max. Seq. Length |
Avg. Seq. Length |
Avg. Mol. Weight |
|---|---|---|---|---|---|---|---|
0 |
977937 |
33 |
2412 |
325.0 |
36.63 |
Amino acid frequency
Ala |
Cys |
Asp |
Glu |
Phe |
Gly |
His |
Ile |
Lys |
Leu |
|---|---|---|---|---|---|---|---|---|---|
6.591 ± 0.046 | 0.739 ± 0.014 |
5.378 ± 0.029 | 6.78 ± 0.055 |
5.486 ± 0.039 | 6.334 ± 0.046 |
1.688 ± 0.022 | 7.942 ± 0.046 |
8.02 ± 0.057 | 9.103 ± 0.052 |
Met |
Asn |
Gln |
Pro |
Arg |
Ser |
Thr |
Val |
Trp |
Tyr |
|---|---|---|---|---|---|---|---|---|---|
2.254 ± 0.021 | 6.141 ± 0.051 |
3.388 ± 0.024 | 3.4 ± 0.022 |
3.302 ± 0.032 | 6.607 ± 0.036 |
5.76 ± 0.062 | 6.187 ± 0.035 |
0.963 ± 0.016 | 3.937 ± 0.03 |
Most of the basic statistics you can see at this page can be downloaded from this CSV file
Proteome-pI is available under Creative Commons Attribution-NoDerivs license, for more details see here
| Reference: Kozlowski LP. Proteome-pI 2.0: Proteome Isoelectric Point Database Update. Nucleic Acids Res. 2021, doi: 10.1093/nar/gkab944 | Contact: Lukasz P. Kozlowski |
