Imtechella halotolerans K1
Taxonomy: cellular organisms; Bacteria; FCB group; Bacteroidetes/Chlorobi group; Bacteroidetes; Flavobacteriia; Flavobacteriales; Flavobacteriaceae; Imtechella; Imtechella halotolerans
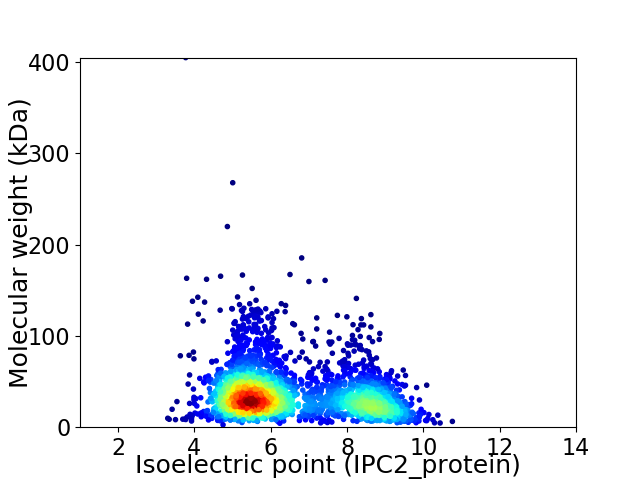
Average proteome isoelectric point is 6.49
Get precalculated fractions of proteins

Virtual 2D-PAGE plot for 2694 proteins (isoelectric point calculated using IPC2_protein)
Get csv file with sequences according to given criteria:
* You can choose from 21 different methods for calculating isoelectric point
Summary statistics related to proteome-wise predictions


Protein with the lowest isoelectric point:
>tr|I0WBR2|I0WBR2_9FLAO RNA-directed DNA polymerase OS=Imtechella halotolerans K1 OX=946077 GN=W5A_09695 PE=4 SV=1
TT1 pKa = 5.45TTFSATYY8 pKa = 9.21TITQSDD14 pKa = 3.26IDD16 pKa = 3.87AGVVVNQATAEE27 pKa = 4.21GSDD30 pKa = 3.69PEE32 pKa = 4.56GNPVIDD38 pKa = 5.3FSGTDD43 pKa = 3.13IDD45 pKa = 4.36NDD47 pKa = 3.67EE48 pKa = 4.15PTITVIEE55 pKa = 4.27STIPLAEE62 pKa = 5.38DD63 pKa = 3.87DD64 pKa = 4.58SVTTGMKK71 pKa = 9.68QPVIISILDD80 pKa = 3.29NDD82 pKa = 3.91EE83 pKa = 4.76ANDD86 pKa = 3.44VGFDD90 pKa = 3.56YY91 pKa = 11.28SSIEE95 pKa = 4.05IISYY99 pKa = 8.88PIHH102 pKa = 5.29GTITIMPDD110 pKa = 2.79GTVLYY115 pKa = 10.05EE116 pKa = 3.64PRR118 pKa = 11.84LDD120 pKa = 3.6VKK122 pKa = 11.37YY123 pKa = 10.76SGTDD127 pKa = 2.7AFTYY131 pKa = 10.17RR132 pKa = 11.84VQDD135 pKa = 4.37GNGKK139 pKa = 5.65WTNVATVTITIPGLFIPNVITPNGDD164 pKa = 3.34TKK166 pKa = 11.51NDD168 pKa = 3.28TFEE171 pKa = 5.86IIGLQSYY178 pKa = 8.4TSAEE182 pKa = 3.81VLIYY186 pKa = 10.52NRR188 pKa = 11.84WGNEE192 pKa = 3.41VYY194 pKa = 10.63RR195 pKa = 11.84NSKK198 pKa = 9.64YY199 pKa = 11.12DD200 pKa = 3.22NTFNGEE206 pKa = 4.0GLNEE210 pKa = 3.7GTYY213 pKa = 10.45YY214 pKa = 11.27YY215 pKa = 10.62LVKK218 pKa = 9.8LTNVNGGVEE227 pKa = 4.89TYY229 pKa = 10.52QGWIFIKK236 pKa = 10.52RR237 pKa = 3.45
TT1 pKa = 5.45TTFSATYY8 pKa = 9.21TITQSDD14 pKa = 3.26IDD16 pKa = 3.87AGVVVNQATAEE27 pKa = 4.21GSDD30 pKa = 3.69PEE32 pKa = 4.56GNPVIDD38 pKa = 5.3FSGTDD43 pKa = 3.13IDD45 pKa = 4.36NDD47 pKa = 3.67EE48 pKa = 4.15PTITVIEE55 pKa = 4.27STIPLAEE62 pKa = 5.38DD63 pKa = 3.87DD64 pKa = 4.58SVTTGMKK71 pKa = 9.68QPVIISILDD80 pKa = 3.29NDD82 pKa = 3.91EE83 pKa = 4.76ANDD86 pKa = 3.44VGFDD90 pKa = 3.56YY91 pKa = 11.28SSIEE95 pKa = 4.05IISYY99 pKa = 8.88PIHH102 pKa = 5.29GTITIMPDD110 pKa = 2.79GTVLYY115 pKa = 10.05EE116 pKa = 3.64PRR118 pKa = 11.84LDD120 pKa = 3.6VKK122 pKa = 11.37YY123 pKa = 10.76SGTDD127 pKa = 2.7AFTYY131 pKa = 10.17RR132 pKa = 11.84VQDD135 pKa = 4.37GNGKK139 pKa = 5.65WTNVATVTITIPGLFIPNVITPNGDD164 pKa = 3.34TKK166 pKa = 11.51NDD168 pKa = 3.28TFEE171 pKa = 5.86IIGLQSYY178 pKa = 8.4TSAEE182 pKa = 3.81VLIYY186 pKa = 10.52NRR188 pKa = 11.84WGNEE192 pKa = 3.41VYY194 pKa = 10.63RR195 pKa = 11.84NSKK198 pKa = 9.64YY199 pKa = 11.12DD200 pKa = 3.22NTFNGEE206 pKa = 4.0GLNEE210 pKa = 3.7GTYY213 pKa = 10.45YY214 pKa = 11.27YY215 pKa = 10.62LVKK218 pKa = 9.8LTNVNGGVEE227 pKa = 4.89TYY229 pKa = 10.52QGWIFIKK236 pKa = 10.52RR237 pKa = 3.45
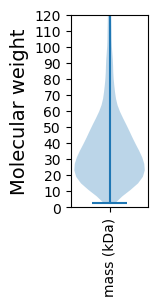
Molecular weight: 26.05 kDa
Isoelectric point according different methods:
Protein with the highest isoelectric point:
>tr|I0WGG3|I0WGG3_9FLAO Sugar phosphate nucleotidyl transferase OS=Imtechella halotolerans K1 OX=946077 GN=W5A_04673 PE=4 SV=1
MM1 pKa = 7.69SKK3 pKa = 9.01RR4 pKa = 11.84TFQPSKK10 pKa = 9.13RR11 pKa = 11.84KK12 pKa = 9.48RR13 pKa = 11.84RR14 pKa = 11.84NKK16 pKa = 9.49HH17 pKa = 3.94GFRR20 pKa = 11.84EE21 pKa = 4.19RR22 pKa = 11.84MATANGRR29 pKa = 11.84KK30 pKa = 8.93VLARR34 pKa = 11.84RR35 pKa = 11.84RR36 pKa = 11.84AKK38 pKa = 10.09GRR40 pKa = 11.84KK41 pKa = 7.97KK42 pKa = 10.52LSVSSEE48 pKa = 3.87PRR50 pKa = 11.84HH51 pKa = 5.92KK52 pKa = 10.61KK53 pKa = 9.84
MM1 pKa = 7.69SKK3 pKa = 9.01RR4 pKa = 11.84TFQPSKK10 pKa = 9.13RR11 pKa = 11.84KK12 pKa = 9.48RR13 pKa = 11.84RR14 pKa = 11.84NKK16 pKa = 9.49HH17 pKa = 3.94GFRR20 pKa = 11.84EE21 pKa = 4.19RR22 pKa = 11.84MATANGRR29 pKa = 11.84KK30 pKa = 8.93VLARR34 pKa = 11.84RR35 pKa = 11.84RR36 pKa = 11.84AKK38 pKa = 10.09GRR40 pKa = 11.84KK41 pKa = 7.97KK42 pKa = 10.52LSVSSEE48 pKa = 3.87PRR50 pKa = 11.84HH51 pKa = 5.92KK52 pKa = 10.61KK53 pKa = 9.84
Molecular weight: 6.33 kDa
Isoelectric point according different methods:
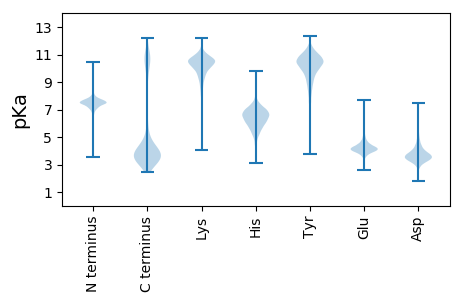
Peptides (in silico digests for buttom-up proteomics)
Below you can find in silico digests of the whole proteome with Trypsin, Chymotrypsin, Trypsin+LysC, LysN, ArgC proteases suitable for different mass spec machines.| Try ESI |
 |
|---|
| ChTry ESI |
 |
|---|
| ArgC ESI |
 |
|---|
| LysN ESI |
 |
|---|
| TryLysC ESI |
 |
|---|
| Try MALDI |
 |
|---|
| ChTry MALDI |
 |
|---|
| ArgC MALDI |
 |
|---|
| LysN MALDI |
 |
|---|
| TryLysC MALDI |
 |
|---|
| Try LTQ |
 |
|---|
| ChTry LTQ |
 |
|---|
| ArgC LTQ |
 |
|---|
| LysN LTQ |
 |
|---|
| TryLysC LTQ |
 |
|---|
| Try MSlow |
 |
|---|
| ChTry MSlow |
 |
|---|
| ArgC MSlow |
 |
|---|
| LysN MSlow |
 |
|---|
| TryLysC MSlow |
 |
|---|
| Try MShigh |
 |
|---|
| ChTry MShigh |
 |
|---|
| ArgC MShigh |
 |
|---|
| LysN MShigh |
 |
|---|
| TryLysC MShigh |
 |
|---|
General Statistics
Number of major isoforms |
Number of additional isoforms |
Number of all proteins |
Number of amino acids |
Min. Seq. Length |
Max. Seq. Length |
Avg. Seq. Length |
Avg. Mol. Weight |
|---|---|---|---|---|---|---|---|
0 |
933156 |
25 |
3778 |
346.4 |
39.11 |
Amino acid frequency
Ala |
Cys |
Asp |
Glu |
Phe |
Gly |
His |
Ile |
Lys |
Leu |
|---|---|---|---|---|---|---|---|---|---|
6.368 ± 0.04 | 0.694 ± 0.016 |
5.199 ± 0.032 | 6.579 ± 0.038 |
5.09 ± 0.033 | 6.453 ± 0.045 |
1.968 ± 0.021 | 7.861 ± 0.041 |
7.127 ± 0.053 | 9.462 ± 0.057 |
Met |
Asn |
Gln |
Pro |
Arg |
Ser |
Thr |
Val |
Trp |
Tyr |
|---|---|---|---|---|---|---|---|---|---|
2.377 ± 0.022 | 5.757 ± 0.047 |
3.524 ± 0.027 | 3.696 ± 0.024 |
3.704 ± 0.032 | 6.665 ± 0.035 |
5.811 ± 0.044 | 6.342 ± 0.039 |
1.1 ± 0.017 | 4.224 ± 0.029 |
Most of the basic statistics you can see at this page can be downloaded from this CSV file
Proteome-pI is available under Creative Commons Attribution-NoDerivs license, for more details see here
| Reference: Kozlowski LP. Proteome-pI 2.0: Proteome Isoelectric Point Database Update. Nucleic Acids Res. 2021, doi: 10.1093/nar/gkab944 | Contact: Lukasz P. Kozlowski |
