Stenotrophomonas daejeonensis
Taxonomy: cellular organisms; Bacteria; Proteobacteria; Gammaproteobacteria; Xanthomonadales; Xanthomonadaceae; Stenotrophomonas
Average proteome isoelectric point is 6.64
Get precalculated fractions of proteins

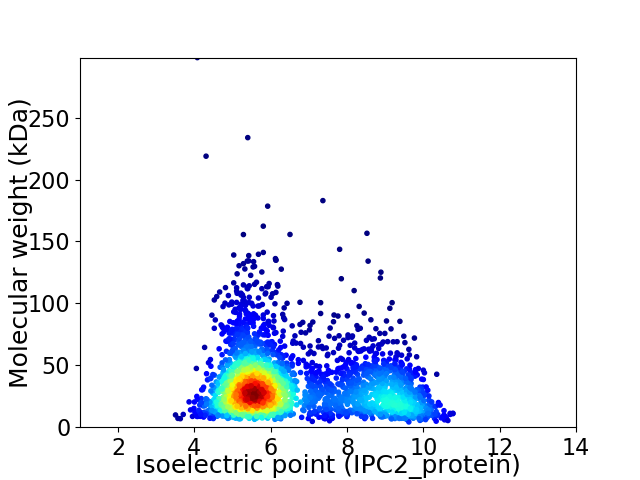
Virtual 2D-PAGE plot for 2805 proteins (isoelectric point calculated using IPC2_protein)
Get csv file with sequences according to given criteria:
* You can choose from 21 different methods for calculating isoelectric point
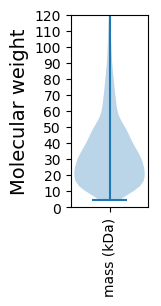
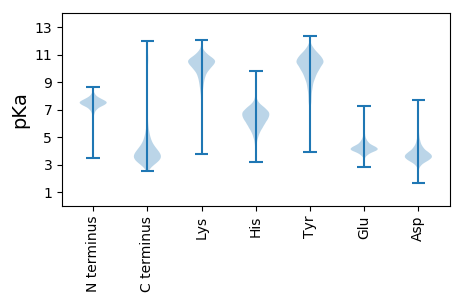
Summary statistics related to proteome-wise predictions


Protein with the lowest isoelectric point:
>tr|A0A0R0EC49|A0A0R0EC49_9GAMM Glucose dehydrogenase OS=Stenotrophomonas daejeonensis OX=659018 GN=ABB34_00055 PE=4 SV=1
MM1 pKa = 7.73SDD3 pKa = 3.12ASASTFRR10 pKa = 11.84TWMCVVCGFIYY21 pKa = 10.55SEE23 pKa = 4.21ADD25 pKa = 3.27GLPEE29 pKa = 3.94EE30 pKa = 5.59GIAAGTRR37 pKa = 11.84WADD40 pKa = 3.95VPDD43 pKa = 3.6TWTCPDD49 pKa = 3.84CGATKK54 pKa = 10.71DD55 pKa = 3.72DD56 pKa = 4.2FEE58 pKa = 4.49MVEE61 pKa = 4.23LDD63 pKa = 3.29
MM1 pKa = 7.73SDD3 pKa = 3.12ASASTFRR10 pKa = 11.84TWMCVVCGFIYY21 pKa = 10.55SEE23 pKa = 4.21ADD25 pKa = 3.27GLPEE29 pKa = 3.94EE30 pKa = 5.59GIAAGTRR37 pKa = 11.84WADD40 pKa = 3.95VPDD43 pKa = 3.6TWTCPDD49 pKa = 3.84CGATKK54 pKa = 10.71DD55 pKa = 3.72DD56 pKa = 4.2FEE58 pKa = 4.49MVEE61 pKa = 4.23LDD63 pKa = 3.29
Molecular weight: 6.87 kDa
Isoelectric point according different methods:
Protein with the highest isoelectric point:
>tr|A0A0R0DXW9|A0A0R0DXW9_9GAMM Histidinol dehydrogenase OS=Stenotrophomonas daejeonensis OX=659018 GN=hisD PE=3 SV=1
MM1 pKa = 6.79NTVTQGLDD9 pKa = 3.09RR10 pKa = 11.84PASPRR15 pKa = 11.84LPGLLLAAAIAGLSAWLGNLPPLQAHH41 pKa = 7.47GIGTLTLAIALGIAAGNAFPDD62 pKa = 4.02ALSSRR67 pKa = 11.84ASAGVDD73 pKa = 3.91FAKK76 pKa = 9.87GTLLRR81 pKa = 11.84AGIVLYY87 pKa = 9.89GLRR90 pKa = 11.84LTLQDD95 pKa = 3.42VAQVGLRR102 pKa = 11.84GVLVDD107 pKa = 5.05ALVLCSTFALACWLGCRR124 pKa = 11.84VLKK127 pKa = 10.69LEE129 pKa = 4.94RR130 pKa = 11.84GTALLIGAGSSICGAAAVMATAPVVKK156 pKa = 10.34GRR158 pKa = 11.84AEE160 pKa = 3.82QAAVAVATVVVFGTLAMFAYY180 pKa = 9.42PLLYY184 pKa = 9.98RR185 pKa = 11.84WGVGAGWMPLDD196 pKa = 3.6EE197 pKa = 5.97AGFGVFTGATVHH209 pKa = 6.47EE210 pKa = 4.72VAQVVAAGRR219 pKa = 11.84AIGPQAADD227 pKa = 3.05AAVIAKK233 pKa = 9.21LVRR236 pKa = 11.84VMMLAPFLLGLSLLLARR253 pKa = 11.84GRR255 pKa = 11.84KK256 pKa = 6.9TVDD259 pKa = 3.13GPRR262 pKa = 11.84PAITVPWFAFGFIGMVAFNSLRR284 pKa = 11.84LLPAPLVEE292 pKa = 4.57ALVGLDD298 pKa = 3.4TALLAMAMAALGLTTRR314 pKa = 11.84ASALRR319 pKa = 11.84RR320 pKa = 11.84AGPRR324 pKa = 11.84PMLLAALLFAWLLGGGMLINLAIHH348 pKa = 7.02ALPP351 pKa = 4.46
MM1 pKa = 6.79NTVTQGLDD9 pKa = 3.09RR10 pKa = 11.84PASPRR15 pKa = 11.84LPGLLLAAAIAGLSAWLGNLPPLQAHH41 pKa = 7.47GIGTLTLAIALGIAAGNAFPDD62 pKa = 4.02ALSSRR67 pKa = 11.84ASAGVDD73 pKa = 3.91FAKK76 pKa = 9.87GTLLRR81 pKa = 11.84AGIVLYY87 pKa = 9.89GLRR90 pKa = 11.84LTLQDD95 pKa = 3.42VAQVGLRR102 pKa = 11.84GVLVDD107 pKa = 5.05ALVLCSTFALACWLGCRR124 pKa = 11.84VLKK127 pKa = 10.69LEE129 pKa = 4.94RR130 pKa = 11.84GTALLIGAGSSICGAAAVMATAPVVKK156 pKa = 10.34GRR158 pKa = 11.84AEE160 pKa = 3.82QAAVAVATVVVFGTLAMFAYY180 pKa = 9.42PLLYY184 pKa = 9.98RR185 pKa = 11.84WGVGAGWMPLDD196 pKa = 3.6EE197 pKa = 5.97AGFGVFTGATVHH209 pKa = 6.47EE210 pKa = 4.72VAQVVAAGRR219 pKa = 11.84AIGPQAADD227 pKa = 3.05AAVIAKK233 pKa = 9.21LVRR236 pKa = 11.84VMMLAPFLLGLSLLLARR253 pKa = 11.84GRR255 pKa = 11.84KK256 pKa = 6.9TVDD259 pKa = 3.13GPRR262 pKa = 11.84PAITVPWFAFGFIGMVAFNSLRR284 pKa = 11.84LLPAPLVEE292 pKa = 4.57ALVGLDD298 pKa = 3.4TALLAMAMAALGLTTRR314 pKa = 11.84ASALRR319 pKa = 11.84RR320 pKa = 11.84AGPRR324 pKa = 11.84PMLLAALLFAWLLGGGMLINLAIHH348 pKa = 7.02ALPP351 pKa = 4.46
Molecular weight: 35.83 kDa
Isoelectric point according different methods:
Peptides (in silico digests for buttom-up proteomics)
Below you can find in silico digests of the whole proteome with Trypsin, Chymotrypsin, Trypsin+LysC, LysN, ArgC proteases suitable for different mass spec machines.| Try ESI |
 |
|---|
| ChTry ESI |
 |
|---|
| ArgC ESI |
 |
|---|
| LysN ESI |
 |
|---|
| TryLysC ESI |
 |
|---|
| Try MALDI |
 |
|---|
| ChTry MALDI |
 |
|---|
| ArgC MALDI |
 |
|---|
| LysN MALDI |
 |
|---|
| TryLysC MALDI |
 |
|---|
| Try LTQ |
 |
|---|
| ChTry LTQ |
 |
|---|
| ArgC LTQ |
 |
|---|
| LysN LTQ |
 |
|---|
| TryLysC LTQ |
 |
|---|
| Try MSlow |
 |
|---|
| ChTry MSlow |
 |
|---|
| ArgC MSlow |
 |
|---|
| LysN MSlow |
 |
|---|
| TryLysC MSlow |
 |
|---|
| Try MShigh |
 |
|---|
| ChTry MShigh |
 |
|---|
| ArgC MShigh |
 |
|---|
| LysN MShigh |
 |
|---|
| TryLysC MShigh |
 |
|---|
General Statistics
Number of major isoforms |
Number of additional isoforms |
Number of all proteins |
Number of amino acids |
Min. Seq. Length |
Max. Seq. Length |
Avg. Seq. Length |
Avg. Mol. Weight |
|---|---|---|---|---|---|---|---|
0 |
929062 |
36 |
2910 |
331.2 |
35.98 |
Amino acid frequency
Ala |
Cys |
Asp |
Glu |
Phe |
Gly |
His |
Ile |
Lys |
Leu |
|---|---|---|---|---|---|---|---|---|---|
13.18 ± 0.066 | 0.812 ± 0.015 |
5.801 ± 0.035 | 5.431 ± 0.041 |
3.347 ± 0.028 | 8.784 ± 0.044 |
2.297 ± 0.026 | 3.971 ± 0.035 |
2.701 ± 0.041 | 11.201 ± 0.058 |
Met |
Asn |
Gln |
Pro |
Arg |
Ser |
Thr |
Val |
Trp |
Tyr |
|---|---|---|---|---|---|---|---|---|---|
2.223 ± 0.024 | 2.542 ± 0.029 |
5.333 ± 0.035 | 3.974 ± 0.03 |
7.689 ± 0.048 | 4.807 ± 0.035 |
4.618 ± 0.035 | 7.452 ± 0.037 |
1.578 ± 0.021 | 2.259 ± 0.026 |
Most of the basic statistics you can see at this page can be downloaded from this CSV file
Proteome-pI is available under Creative Commons Attribution-NoDerivs license, for more details see here
| Reference: Kozlowski LP. Proteome-pI 2.0: Proteome Isoelectric Point Database Update. Nucleic Acids Res. 2021, doi: 10.1093/nar/gkab944 | Contact: Lukasz P. Kozlowski |
