Alcelaphine herpesvirus 1 (strain C500) (AlHV-1) (Malignant catarrhal fever virus)
Taxonomy: Viruses; Duplodnaviria; Heunggongvirae; Peploviricota; Herviviricetes; Herpesvirales; Herpesviridae; Gammaherpesvirinae; Macavirus; Alcelaphine gammaherpesvirus 1
Average proteome isoelectric point is 6.56
Get precalculated fractions of proteins

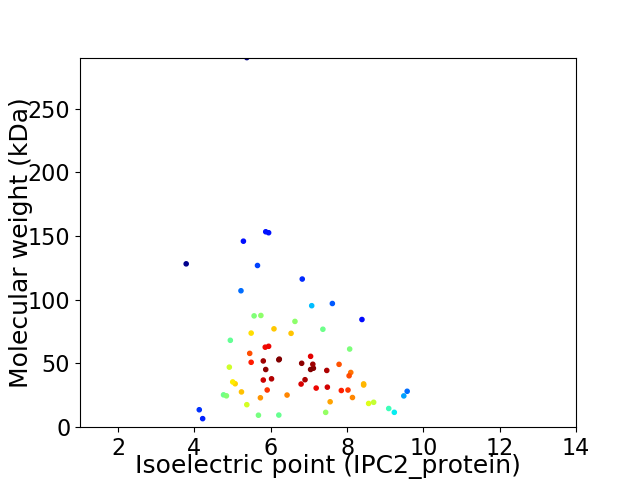
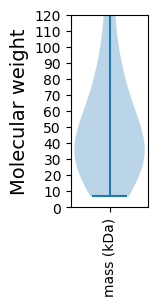
Virtual 2D-PAGE plot for 70 proteins (isoelectric point calculated using IPC2_protein)
Get csv file with sequences according to given criteria:
* You can choose from 21 different methods for calculating isoelectric point
Summary statistics related to proteome-wise predictions


Protein with the lowest isoelectric point:
>sp|O36360|DNBI_ALHV1 Major DNA-binding protein OS=Alcelaphine herpesvirus 1 (strain C500) OX=654901 GN=DBP PE=3 SV=1
MM1 pKa = 7.21VAQLYY6 pKa = 9.75HH7 pKa = 6.95HH8 pKa = 6.73LTILIASIYY17 pKa = 10.37IIFFVNAAPTLYY29 pKa = 10.54EE30 pKa = 5.04DD31 pKa = 5.46DD32 pKa = 5.05EE33 pKa = 4.96EE34 pKa = 5.52DD35 pKa = 4.37FNSTEE40 pKa = 3.81YY41 pKa = 11.19DD42 pKa = 3.43VFLDD46 pKa = 3.32SDD48 pKa = 3.82SFQFPRR54 pKa = 11.84RR55 pKa = 11.84NSSCNCTRR63 pKa = 11.84EE64 pKa = 3.92EE65 pKa = 3.94ATRR68 pKa = 11.84TLLEE72 pKa = 3.95ALKK75 pKa = 10.53RR76 pKa = 11.84ALQIIAGYY84 pKa = 10.18INEE87 pKa = 4.52TDD89 pKa = 3.61TEE91 pKa = 4.31EE92 pKa = 4.6LPTYY96 pKa = 8.86PPTMTTPLEE105 pKa = 4.2TTPLDD110 pKa = 3.39TSPPVLPSAIPP121 pKa = 3.31
MM1 pKa = 7.21VAQLYY6 pKa = 9.75HH7 pKa = 6.95HH8 pKa = 6.73LTILIASIYY17 pKa = 10.37IIFFVNAAPTLYY29 pKa = 10.54EE30 pKa = 5.04DD31 pKa = 5.46DD32 pKa = 5.05EE33 pKa = 4.96EE34 pKa = 5.52DD35 pKa = 4.37FNSTEE40 pKa = 3.81YY41 pKa = 11.19DD42 pKa = 3.43VFLDD46 pKa = 3.32SDD48 pKa = 3.82SFQFPRR54 pKa = 11.84RR55 pKa = 11.84NSSCNCTRR63 pKa = 11.84EE64 pKa = 3.92EE65 pKa = 3.94ATRR68 pKa = 11.84TLLEE72 pKa = 3.95ALKK75 pKa = 10.53RR76 pKa = 11.84ALQIIAGYY84 pKa = 10.18INEE87 pKa = 4.52TDD89 pKa = 3.61TEE91 pKa = 4.31EE92 pKa = 4.6LPTYY96 pKa = 8.86PPTMTTPLEE105 pKa = 4.2TTPLDD110 pKa = 3.39TSPPVLPSAIPP121 pKa = 3.31
Molecular weight: 13.69 kDa
Isoelectric point according different methods:
Protein with the highest isoelectric point:
>sp|O36416|UL49_ALHV1 Uncharacterized gene 66 protein OS=Alcelaphine herpesvirus 1 (strain C500) OX=654901 GN=66 PE=3 SV=1
MM1 pKa = 7.12AHH3 pKa = 7.11ARR5 pKa = 11.84PKK7 pKa = 10.49LPRR10 pKa = 11.84INLRR14 pKa = 11.84LDD16 pKa = 3.19AEE18 pKa = 4.55YY19 pKa = 10.24PNDD22 pKa = 3.45PRR24 pKa = 11.84VQQLHH29 pKa = 5.79LQILNNPNYY38 pKa = 9.8ANNVRR43 pKa = 11.84APLSYY48 pKa = 10.88LVFLTAQEE56 pKa = 4.14MYY58 pKa = 10.68EE59 pKa = 4.22VFVRR63 pKa = 11.84QARR66 pKa = 11.84GVNKK70 pKa = 9.6KK71 pKa = 10.43RR72 pKa = 11.84SGGPEE77 pKa = 4.03KK78 pKa = 10.44PILPANPGAGPQNAPGCGGGGSGSGGSGPPGGSAPQIQPPNNGVPSNQVSSNSGSAAGSGSGSGASSNSGAGSGAGAGSSACPSSGAGSGAGAGSSAGSNVQAPPAPPPLPQVPMVPGVVNGQEE202 pKa = 4.18MYY204 pKa = 11.08LPLGPVNGLPQQLGTAGSDD223 pKa = 3.27NSGGQASSPGSQNPPTKK240 pKa = 10.06PVAPRR245 pKa = 11.84GKK247 pKa = 9.96LGKK250 pKa = 10.43GRR252 pKa = 3.76
MM1 pKa = 7.12AHH3 pKa = 7.11ARR5 pKa = 11.84PKK7 pKa = 10.49LPRR10 pKa = 11.84INLRR14 pKa = 11.84LDD16 pKa = 3.19AEE18 pKa = 4.55YY19 pKa = 10.24PNDD22 pKa = 3.45PRR24 pKa = 11.84VQQLHH29 pKa = 5.79LQILNNPNYY38 pKa = 9.8ANNVRR43 pKa = 11.84APLSYY48 pKa = 10.88LVFLTAQEE56 pKa = 4.14MYY58 pKa = 10.68EE59 pKa = 4.22VFVRR63 pKa = 11.84QARR66 pKa = 11.84GVNKK70 pKa = 9.6KK71 pKa = 10.43RR72 pKa = 11.84SGGPEE77 pKa = 4.03KK78 pKa = 10.44PILPANPGAGPQNAPGCGGGGSGSGGSGPPGGSAPQIQPPNNGVPSNQVSSNSGSAAGSGSGSGASSNSGAGSGAGAGSSACPSSGAGSGAGAGSSAGSNVQAPPAPPPLPQVPMVPGVVNGQEE202 pKa = 4.18MYY204 pKa = 11.08LPLGPVNGLPQQLGTAGSDD223 pKa = 3.27NSGGQASSPGSQNPPTKK240 pKa = 10.06PVAPRR245 pKa = 11.84GKK247 pKa = 9.96LGKK250 pKa = 10.43GRR252 pKa = 3.76
Molecular weight: 24.55 kDa
Isoelectric point according different methods:
Peptides (in silico digests for buttom-up proteomics)
Below you can find in silico digests of the whole proteome with Trypsin, Chymotrypsin, Trypsin+LysC, LysN, ArgC proteases suitable for different mass spec machines.| Try ESI |
 |
|---|
| ChTry ESI |
 |
|---|
| ArgC ESI |
 |
|---|
| LysN ESI |
 |
|---|
| TryLysC ESI |
 |
|---|
| Try MALDI |
 |
|---|
| ChTry MALDI |
 |
|---|
| ArgC MALDI |
 |
|---|
| LysN MALDI |
 |
|---|
| TryLysC MALDI |
 |
|---|
| Try LTQ |
 |
|---|
| ChTry LTQ |
 |
|---|
| ArgC LTQ |
 |
|---|
| LysN LTQ |
 |
|---|
| TryLysC LTQ |
 |
|---|
| Try MSlow |
 |
|---|
| ChTry MSlow |
 |
|---|
| ArgC MSlow |
 |
|---|
| LysN MSlow |
 |
|---|
| TryLysC MSlow |
 |
|---|
| Try MShigh |
 |
|---|
| ChTry MShigh |
 |
|---|
| ArgC MShigh |
 |
|---|
| LysN MShigh |
 |
|---|
| TryLysC MShigh |
 |
|---|
General Statistics
Number of major isoforms |
Number of additional isoforms |
Number of all proteins |
Number of amino acids |
Min. Seq. Length |
Max. Seq. Length |
Avg. Seq. Length |
Avg. Mol. Weight |
|---|---|---|---|---|---|---|---|
0 |
34799 |
59 |
2606 |
497.1 |
55.47 |
Amino acid frequency
Ala |
Cys |
Asp |
Glu |
Phe |
Gly |
His |
Ile |
Lys |
Leu |
|---|---|---|---|---|---|---|---|---|---|
6.313 ± 0.276 | 2.624 ± 0.19 |
4.647 ± 0.171 | 5.828 ± 0.606 |
4.793 ± 0.211 | 5.742 ± 0.964 |
2.489 ± 0.119 | 5.178 ± 0.219 |
5.296 ± 0.224 | 10.311 ± 0.391 |
Met |
Asn |
Gln |
Pro |
Arg |
Ser |
Thr |
Val |
Trp |
Tyr |
|---|---|---|---|---|---|---|---|---|---|
2.121 ± 0.107 | 4.92 ± 0.23 |
5.974 ± 0.449 | 4.25 ± 0.222 |
3.928 ± 0.202 | 8.316 ± 0.251 |
6.29 ± 0.273 | 6.423 ± 0.241 |
1.06 ± 0.066 | 3.497 ± 0.167 |
Most of the basic statistics you can see at this page can be downloaded from this CSV file
Proteome-pI is available under Creative Commons Attribution-NoDerivs license, for more details see here
| Reference: Kozlowski LP. Proteome-pI 2.0: Proteome Isoelectric Point Database Update. Nucleic Acids Res. 2021, doi: 10.1093/nar/gkab944 | Contact: Lukasz P. Kozlowski |
