Actinomyces massiliensis F0489
Taxonomy: cellular organisms; Bacteria; Terrabacteria group; Actinobacteria; Actinomycetia; Actinomycetales; Actinomycetaceae; Actinomyces; Actinomyces massiliensis
Average proteome isoelectric point is 6.25
Get precalculated fractions of proteins

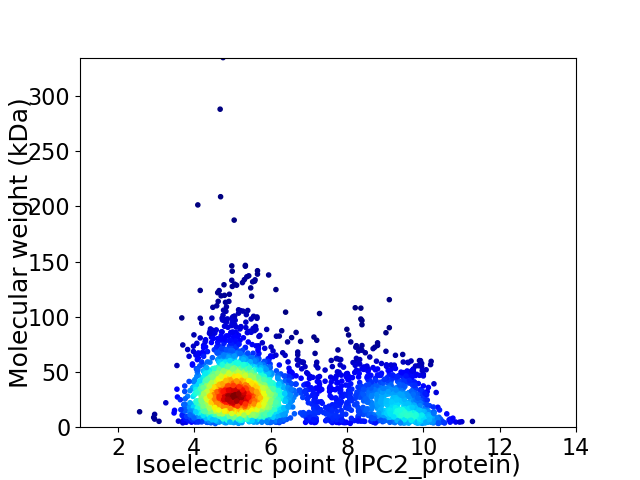
Virtual 2D-PAGE plot for 3129 proteins (isoelectric point calculated using IPC2_protein)
Get csv file with sequences according to given criteria:
* You can choose from 21 different methods for calculating isoelectric point
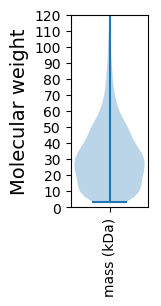
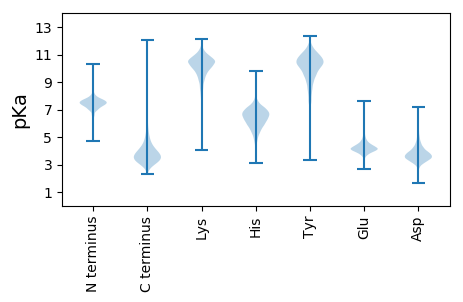
Summary statistics related to proteome-wise predictions


Protein with the lowest isoelectric point:
>tr|J1HN19|J1HN19_9ACTO Uncharacterized protein OS=Actinomyces massiliensis F0489 OX=1125718 GN=HMPREF1318_2069 PE=4 SV=1
MM1 pKa = 6.23SQKK4 pKa = 10.35RR5 pKa = 11.84FVSRR9 pKa = 11.84PRR11 pKa = 11.84AYY13 pKa = 9.93GVVGLVVVALCAWGLGSQHH32 pKa = 6.06GAAGGAKK39 pKa = 8.59DD40 pKa = 3.94TEE42 pKa = 4.58DD43 pKa = 3.73AEE45 pKa = 4.51HH46 pKa = 6.96AKK48 pKa = 10.35GAGYY52 pKa = 10.55FEE54 pKa = 4.99TVQSSGSSSVLLGDD68 pKa = 4.56DD69 pKa = 3.94SPVIDD74 pKa = 3.76TMRR77 pKa = 11.84SQDD80 pKa = 3.24VGAQEE85 pKa = 4.93LLVTGDD91 pKa = 3.7GVSTGSVSAVDD102 pKa = 3.45VDD104 pKa = 4.16GDD106 pKa = 4.32AEE108 pKa = 4.76LGTADD113 pKa = 3.37STTYY117 pKa = 10.87VYY119 pKa = 10.03TPPGYY124 pKa = 10.18DD125 pKa = 2.87AGSSTRR131 pKa = 11.84YY132 pKa = 8.6SVVYY136 pKa = 9.91LFHH139 pKa = 6.81GTPGWSSDD147 pKa = 3.27WFSGTALASRR157 pKa = 11.84LDD159 pKa = 3.63RR160 pKa = 11.84LIDD163 pKa = 4.35DD164 pKa = 4.39GAIPPVIAVSPEE176 pKa = 3.16ISTPEE181 pKa = 3.9VSDD184 pKa = 3.73TRR186 pKa = 11.84CLDD189 pKa = 3.4STTDD193 pKa = 3.36GPLIDD198 pKa = 4.19TYY200 pKa = 10.31LTQGVVPWVDD210 pKa = 3.45EE211 pKa = 4.64TYY213 pKa = 9.68STYY216 pKa = 11.41ADD218 pKa = 3.58ADD220 pKa = 3.57HH221 pKa = 6.62RR222 pKa = 11.84VLMGFSMGAFCATNLLFQHH241 pKa = 6.28QDD243 pKa = 3.15MFSSAAAMADD253 pKa = 3.48YY254 pKa = 10.95GEE256 pKa = 5.15PGADD260 pKa = 3.59AAPLLADD267 pKa = 3.56DD268 pKa = 4.84VEE270 pKa = 4.67YY271 pKa = 10.84EE272 pKa = 4.13RR273 pKa = 11.84QSPAVYY279 pKa = 10.48LSDD282 pKa = 3.93PDD284 pKa = 3.51FALRR288 pKa = 11.84DD289 pKa = 3.85GLSLYY294 pKa = 9.5LTVGGQSLDD303 pKa = 3.26VDD305 pKa = 3.87VDD307 pKa = 4.0DD308 pKa = 5.09TPLLADD314 pKa = 3.74MAAEE318 pKa = 4.01RR319 pKa = 11.84GVTVIYY325 pKa = 10.55EE326 pKa = 3.93PDD328 pKa = 3.06EE329 pKa = 4.57AADD332 pKa = 4.55HH333 pKa = 6.67DD334 pKa = 3.99WQMVSDD340 pKa = 4.27HH341 pKa = 6.86VDD343 pKa = 3.01GALEE347 pKa = 3.79MLLTDD352 pKa = 4.51GAA354 pKa = 4.26
MM1 pKa = 6.23SQKK4 pKa = 10.35RR5 pKa = 11.84FVSRR9 pKa = 11.84PRR11 pKa = 11.84AYY13 pKa = 9.93GVVGLVVVALCAWGLGSQHH32 pKa = 6.06GAAGGAKK39 pKa = 8.59DD40 pKa = 3.94TEE42 pKa = 4.58DD43 pKa = 3.73AEE45 pKa = 4.51HH46 pKa = 6.96AKK48 pKa = 10.35GAGYY52 pKa = 10.55FEE54 pKa = 4.99TVQSSGSSSVLLGDD68 pKa = 4.56DD69 pKa = 3.94SPVIDD74 pKa = 3.76TMRR77 pKa = 11.84SQDD80 pKa = 3.24VGAQEE85 pKa = 4.93LLVTGDD91 pKa = 3.7GVSTGSVSAVDD102 pKa = 3.45VDD104 pKa = 4.16GDD106 pKa = 4.32AEE108 pKa = 4.76LGTADD113 pKa = 3.37STTYY117 pKa = 10.87VYY119 pKa = 10.03TPPGYY124 pKa = 10.18DD125 pKa = 2.87AGSSTRR131 pKa = 11.84YY132 pKa = 8.6SVVYY136 pKa = 9.91LFHH139 pKa = 6.81GTPGWSSDD147 pKa = 3.27WFSGTALASRR157 pKa = 11.84LDD159 pKa = 3.63RR160 pKa = 11.84LIDD163 pKa = 4.35DD164 pKa = 4.39GAIPPVIAVSPEE176 pKa = 3.16ISTPEE181 pKa = 3.9VSDD184 pKa = 3.73TRR186 pKa = 11.84CLDD189 pKa = 3.4STTDD193 pKa = 3.36GPLIDD198 pKa = 4.19TYY200 pKa = 10.31LTQGVVPWVDD210 pKa = 3.45EE211 pKa = 4.64TYY213 pKa = 9.68STYY216 pKa = 11.41ADD218 pKa = 3.58ADD220 pKa = 3.57HH221 pKa = 6.62RR222 pKa = 11.84VLMGFSMGAFCATNLLFQHH241 pKa = 6.28QDD243 pKa = 3.15MFSSAAAMADD253 pKa = 3.48YY254 pKa = 10.95GEE256 pKa = 5.15PGADD260 pKa = 3.59AAPLLADD267 pKa = 3.56DD268 pKa = 4.84VEE270 pKa = 4.67YY271 pKa = 10.84EE272 pKa = 4.13RR273 pKa = 11.84QSPAVYY279 pKa = 10.48LSDD282 pKa = 3.93PDD284 pKa = 3.51FALRR288 pKa = 11.84DD289 pKa = 3.85GLSLYY294 pKa = 9.5LTVGGQSLDD303 pKa = 3.26VDD305 pKa = 3.87VDD307 pKa = 4.0DD308 pKa = 5.09TPLLADD314 pKa = 3.74MAAEE318 pKa = 4.01RR319 pKa = 11.84GVTVIYY325 pKa = 10.55EE326 pKa = 3.93PDD328 pKa = 3.06EE329 pKa = 4.57AADD332 pKa = 4.55HH333 pKa = 6.67DD334 pKa = 3.99WQMVSDD340 pKa = 4.27HH341 pKa = 6.86VDD343 pKa = 3.01GALEE347 pKa = 3.79MLLTDD352 pKa = 4.51GAA354 pKa = 4.26
Molecular weight: 37.3 kDa
Isoelectric point according different methods:
Protein with the highest isoelectric point:
>tr|J1HLS1|J1HLS1_9ACTO Chaperone protein DnaK OS=Actinomyces massiliensis F0489 OX=1125718 GN=dnaK PE=2 SV=1
MM1 pKa = 7.69SKK3 pKa = 9.0RR4 pKa = 11.84TFQPNNRR11 pKa = 11.84HH12 pKa = 5.28RR13 pKa = 11.84AKK15 pKa = 10.38VHH17 pKa = 5.28GFRR20 pKa = 11.84KK21 pKa = 9.95RR22 pKa = 11.84MSTRR26 pKa = 11.84AGRR29 pKa = 11.84AVLAARR35 pKa = 11.84RR36 pKa = 11.84RR37 pKa = 11.84KK38 pKa = 9.68GRR40 pKa = 11.84ARR42 pKa = 11.84LAAA45 pKa = 4.44
MM1 pKa = 7.69SKK3 pKa = 9.0RR4 pKa = 11.84TFQPNNRR11 pKa = 11.84HH12 pKa = 5.28RR13 pKa = 11.84AKK15 pKa = 10.38VHH17 pKa = 5.28GFRR20 pKa = 11.84KK21 pKa = 9.95RR22 pKa = 11.84MSTRR26 pKa = 11.84AGRR29 pKa = 11.84AVLAARR35 pKa = 11.84RR36 pKa = 11.84RR37 pKa = 11.84KK38 pKa = 9.68GRR40 pKa = 11.84ARR42 pKa = 11.84LAAA45 pKa = 4.44
Molecular weight: 5.23 kDa
Isoelectric point according different methods:
Peptides (in silico digests for buttom-up proteomics)
Below you can find in silico digests of the whole proteome with Trypsin, Chymotrypsin, Trypsin+LysC, LysN, ArgC proteases suitable for different mass spec machines.| Try ESI |
 |
|---|
| ChTry ESI |
 |
|---|
| ArgC ESI |
 |
|---|
| LysN ESI |
 |
|---|
| TryLysC ESI |
 |
|---|
| Try MALDI |
 |
|---|
| ChTry MALDI |
 |
|---|
| ArgC MALDI |
 |
|---|
| LysN MALDI |
 |
|---|
| TryLysC MALDI |
 |
|---|
| Try LTQ |
 |
|---|
| ChTry LTQ |
 |
|---|
| ArgC LTQ |
 |
|---|
| LysN LTQ |
 |
|---|
| TryLysC LTQ |
 |
|---|
| Try MSlow |
 |
|---|
| ChTry MSlow |
 |
|---|
| ArgC MSlow |
 |
|---|
| LysN MSlow |
 |
|---|
| TryLysC MSlow |
 |
|---|
| Try MShigh |
 |
|---|
| ChTry MShigh |
 |
|---|
| ArgC MShigh |
 |
|---|
| LysN MShigh |
 |
|---|
| TryLysC MShigh |
 |
|---|
General Statistics
Number of major isoforms |
Number of additional isoforms |
Number of all proteins |
Number of amino acids |
Min. Seq. Length |
Max. Seq. Length |
Avg. Seq. Length |
Avg. Mol. Weight |
|---|---|---|---|---|---|---|---|
0 |
984542 |
34 |
3202 |
314.7 |
33.53 |
Amino acid frequency
Ala |
Cys |
Asp |
Glu |
Phe |
Gly |
His |
Ile |
Lys |
Leu |
|---|---|---|---|---|---|---|---|---|---|
13.608 ± 0.066 | 0.785 ± 0.013 |
6.133 ± 0.042 | 5.617 ± 0.04 |
2.469 ± 0.025 | 9.036 ± 0.041 |
2.025 ± 0.019 | 4.139 ± 0.032 |
1.865 ± 0.028 | 9.998 ± 0.056 |
Met |
Asn |
Gln |
Pro |
Arg |
Ser |
Thr |
Val |
Trp |
Tyr |
|---|---|---|---|---|---|---|---|---|---|
2.117 ± 0.018 | 1.862 ± 0.024 |
5.671 ± 0.037 | 2.728 ± 0.026 |
7.585 ± 0.053 | 6.369 ± 0.035 |
6.191 ± 0.039 | 8.424 ± 0.038 |
1.485 ± 0.017 | 1.891 ± 0.02 |
Most of the basic statistics you can see at this page can be downloaded from this CSV file
Proteome-pI is available under Creative Commons Attribution-NoDerivs license, for more details see here
| Reference: Kozlowski LP. Proteome-pI 2.0: Proteome Isoelectric Point Database Update. Nucleic Acids Res. 2021, doi: 10.1093/nar/gkab944 | Contact: Lukasz P. Kozlowski |
