Rhodobacteraceae bacterium WD3A24
Taxonomy: cellular organisms; Bacteria; Proteobacteria; Alphaproteobacteria; Rhodobacterales; Rhodobacteraceae; unclassified Rhodobacteraceae
Average proteome isoelectric point is 6.29
Get precalculated fractions of proteins

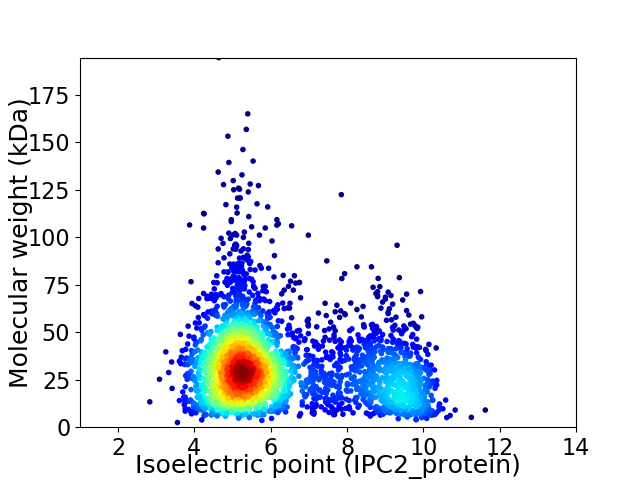
Virtual 2D-PAGE plot for 3201 proteins (isoelectric point calculated using IPC2_protein)
Get csv file with sequences according to given criteria:
* You can choose from 21 different methods for calculating isoelectric point
Summary statistics related to proteome-wise predictions


Protein with the lowest isoelectric point:
>tr|A0A2S8ERE2|A0A2S8ERE2_9RHOB Cytochrome c1 OS=Rhodobacteraceae bacterium WD3A24 OX=2086263 GN=C2I36_12535 PE=4 SV=1
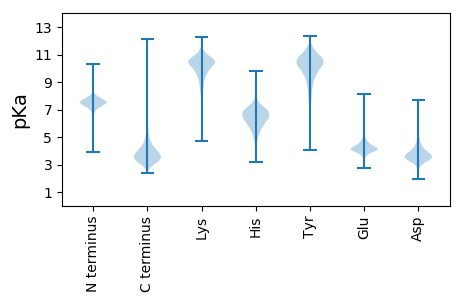
MM1 pKa = 8.0KK2 pKa = 10.5YY3 pKa = 9.95PIIAAGVLVAGMAHH17 pKa = 6.25AQSEE21 pKa = 4.71QPTLTVYY28 pKa = 9.88TYY30 pKa = 11.17EE31 pKa = 4.62SFVSDD36 pKa = 3.98WGPGPVIEE44 pKa = 4.94EE45 pKa = 3.91NFEE48 pKa = 4.52AICACDD54 pKa = 3.6LRR56 pKa = 11.84LVGVGDD62 pKa = 3.72GAEE65 pKa = 3.87LLGRR69 pKa = 11.84LRR71 pKa = 11.84LEE73 pKa = 4.69GPRR76 pKa = 11.84TDD78 pKa = 3.49ADD80 pKa = 3.76VVLGLDD86 pKa = 3.35TNLIARR92 pKa = 11.84AEE94 pKa = 4.34GTGLFAPHH102 pKa = 7.12GIEE105 pKa = 4.71APEE108 pKa = 3.79FDD110 pKa = 5.5MPVDD114 pKa = 3.31WDD116 pKa = 3.9NPTFLPYY123 pKa = 10.58DD124 pKa = 3.12WGYY127 pKa = 10.21FAFVYY132 pKa = 10.66DD133 pKa = 3.85SDD135 pKa = 4.71VVFDD139 pKa = 4.21PPEE142 pKa = 4.26SFGEE146 pKa = 4.6LIDD149 pKa = 4.31SDD151 pKa = 4.61LSVVIQDD158 pKa = 4.46PRR160 pKa = 11.84SSTPGLGLLMWVKK173 pKa = 10.36AAYY176 pKa = 10.2GDD178 pKa = 3.96DD179 pKa = 4.23APEE182 pKa = 3.82IWEE185 pKa = 4.21GLAPRR190 pKa = 11.84VLTVTQGWSEE200 pKa = 4.28AYY202 pKa = 10.31GLFTEE207 pKa = 5.91GEE209 pKa = 3.84ADD211 pKa = 3.25MALSYY216 pKa = 7.64TTSPAYY222 pKa = 10.24HH223 pKa = 7.32LIAEE227 pKa = 5.09DD228 pKa = 3.99DD229 pKa = 3.88PSYY232 pKa = 11.01AAAVFEE238 pKa = 4.84EE239 pKa = 4.26GHH241 pKa = 5.37YY242 pKa = 9.51MQVEE246 pKa = 4.25VAGRR250 pKa = 11.84IAASDD255 pKa = 3.73QPEE258 pKa = 4.07LAQEE262 pKa = 4.5FLRR265 pKa = 11.84FMLTDD270 pKa = 4.23GFQGVIPTTNWMYY283 pKa = 10.52PAVTPEE289 pKa = 3.86GGLPEE294 pKa = 4.6GFEE297 pKa = 4.3TLADD301 pKa = 4.41PDD303 pKa = 3.96TALLFSAQEE312 pKa = 3.79AAEE315 pKa = 4.27LRR317 pKa = 11.84DD318 pKa = 3.5AALDD322 pKa = 3.38EE323 pKa = 4.29WLNALSRR330 pKa = 3.92
MM1 pKa = 8.0KK2 pKa = 10.5YY3 pKa = 9.95PIIAAGVLVAGMAHH17 pKa = 6.25AQSEE21 pKa = 4.71QPTLTVYY28 pKa = 9.88TYY30 pKa = 11.17EE31 pKa = 4.62SFVSDD36 pKa = 3.98WGPGPVIEE44 pKa = 4.94EE45 pKa = 3.91NFEE48 pKa = 4.52AICACDD54 pKa = 3.6LRR56 pKa = 11.84LVGVGDD62 pKa = 3.72GAEE65 pKa = 3.87LLGRR69 pKa = 11.84LRR71 pKa = 11.84LEE73 pKa = 4.69GPRR76 pKa = 11.84TDD78 pKa = 3.49ADD80 pKa = 3.76VVLGLDD86 pKa = 3.35TNLIARR92 pKa = 11.84AEE94 pKa = 4.34GTGLFAPHH102 pKa = 7.12GIEE105 pKa = 4.71APEE108 pKa = 3.79FDD110 pKa = 5.5MPVDD114 pKa = 3.31WDD116 pKa = 3.9NPTFLPYY123 pKa = 10.58DD124 pKa = 3.12WGYY127 pKa = 10.21FAFVYY132 pKa = 10.66DD133 pKa = 3.85SDD135 pKa = 4.71VVFDD139 pKa = 4.21PPEE142 pKa = 4.26SFGEE146 pKa = 4.6LIDD149 pKa = 4.31SDD151 pKa = 4.61LSVVIQDD158 pKa = 4.46PRR160 pKa = 11.84SSTPGLGLLMWVKK173 pKa = 10.36AAYY176 pKa = 10.2GDD178 pKa = 3.96DD179 pKa = 4.23APEE182 pKa = 3.82IWEE185 pKa = 4.21GLAPRR190 pKa = 11.84VLTVTQGWSEE200 pKa = 4.28AYY202 pKa = 10.31GLFTEE207 pKa = 5.91GEE209 pKa = 3.84ADD211 pKa = 3.25MALSYY216 pKa = 7.64TTSPAYY222 pKa = 10.24HH223 pKa = 7.32LIAEE227 pKa = 5.09DD228 pKa = 3.99DD229 pKa = 3.88PSYY232 pKa = 11.01AAAVFEE238 pKa = 4.84EE239 pKa = 4.26GHH241 pKa = 5.37YY242 pKa = 9.51MQVEE246 pKa = 4.25VAGRR250 pKa = 11.84IAASDD255 pKa = 3.73QPEE258 pKa = 4.07LAQEE262 pKa = 4.5FLRR265 pKa = 11.84FMLTDD270 pKa = 4.23GFQGVIPTTNWMYY283 pKa = 10.52PAVTPEE289 pKa = 3.86GGLPEE294 pKa = 4.6GFEE297 pKa = 4.3TLADD301 pKa = 4.41PDD303 pKa = 3.96TALLFSAQEE312 pKa = 3.79AAEE315 pKa = 4.27LRR317 pKa = 11.84DD318 pKa = 3.5AALDD322 pKa = 3.38EE323 pKa = 4.29WLNALSRR330 pKa = 3.92
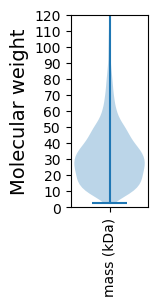
Molecular weight: 35.9 kDa
Isoelectric point according different methods:
Protein with the highest isoelectric point:
>tr|A0A2S8EW26|A0A2S8EW26_9RHOB Acetolactate synthase OS=Rhodobacteraceae bacterium WD3A24 OX=2086263 GN=C2I36_04165 PE=3 SV=1
MM1 pKa = 7.45KK2 pKa = 9.61RR3 pKa = 11.84TFQPSNLVRR12 pKa = 11.84KK13 pKa = 8.96RR14 pKa = 11.84RR15 pKa = 11.84HH16 pKa = 4.62GFRR19 pKa = 11.84SRR21 pKa = 11.84MATKK25 pKa = 10.45AGRR28 pKa = 11.84KK29 pKa = 8.56ILNARR34 pKa = 11.84RR35 pKa = 11.84KK36 pKa = 9.5RR37 pKa = 11.84GRR39 pKa = 11.84AKK41 pKa = 10.74LSAA44 pKa = 4.0
MM1 pKa = 7.45KK2 pKa = 9.61RR3 pKa = 11.84TFQPSNLVRR12 pKa = 11.84KK13 pKa = 8.96RR14 pKa = 11.84RR15 pKa = 11.84HH16 pKa = 4.62GFRR19 pKa = 11.84SRR21 pKa = 11.84MATKK25 pKa = 10.45AGRR28 pKa = 11.84KK29 pKa = 8.56ILNARR34 pKa = 11.84RR35 pKa = 11.84KK36 pKa = 9.5RR37 pKa = 11.84GRR39 pKa = 11.84AKK41 pKa = 10.74LSAA44 pKa = 4.0
Molecular weight: 5.19 kDa
Isoelectric point according different methods:
Peptides (in silico digests for buttom-up proteomics)
Below you can find in silico digests of the whole proteome with Trypsin, Chymotrypsin, Trypsin+LysC, LysN, ArgC proteases suitable for different mass spec machines.| Try ESI |
 |
|---|
| ChTry ESI |
 |
|---|
| ArgC ESI |
 |
|---|
| LysN ESI |
 |
|---|
| TryLysC ESI |
 |
|---|
| Try MALDI |
 |
|---|
| ChTry MALDI |
 |
|---|
| ArgC MALDI |
 |
|---|
| LysN MALDI |
 |
|---|
| TryLysC MALDI |
 |
|---|
| Try LTQ |
 |
|---|
| ChTry LTQ |
 |
|---|
| ArgC LTQ |
 |
|---|
| LysN LTQ |
 |
|---|
| TryLysC LTQ |
 |
|---|
| Try MSlow |
 |
|---|
| ChTry MSlow |
 |
|---|
| ArgC MSlow |
 |
|---|
| LysN MSlow |
 |
|---|
| TryLysC MSlow |
 |
|---|
| Try MShigh |
 |
|---|
| ChTry MShigh |
 |
|---|
| ArgC MShigh |
 |
|---|
| LysN MShigh |
 |
|---|
| TryLysC MShigh |
 |
|---|
General Statistics
Number of major isoforms |
Number of additional isoforms |
Number of all proteins |
Number of amino acids |
Min. Seq. Length |
Max. Seq. Length |
Avg. Seq. Length |
Avg. Mol. Weight |
|---|---|---|---|---|---|---|---|
0 |
994201 |
27 |
1832 |
310.6 |
33.56 |
Amino acid frequency
Ala |
Cys |
Asp |
Glu |
Phe |
Gly |
His |
Ile |
Lys |
Leu |
|---|---|---|---|---|---|---|---|---|---|
13.878 ± 0.062 | 0.831 ± 0.014 |
5.978 ± 0.037 | 6.363 ± 0.048 |
3.496 ± 0.029 | 9.246 ± 0.041 |
2.1 ± 0.019 | 4.639 ± 0.029 |
2.08 ± 0.034 | 10.039 ± 0.06 |
Met |
Asn |
Gln |
Pro |
Arg |
Ser |
Thr |
Val |
Trp |
Tyr |
|---|---|---|---|---|---|---|---|---|---|
2.648 ± 0.018 | 2.125 ± 0.023 |
5.449 ± 0.029 | 2.744 ± 0.022 |
8.213 ± 0.048 | 4.532 ± 0.026 |
5.04 ± 0.029 | 7.157 ± 0.036 |
1.418 ± 0.022 | 2.025 ± 0.019 |
Most of the basic statistics you can see at this page can be downloaded from this CSV file
Proteome-pI is available under Creative Commons Attribution-NoDerivs license, for more details see here
| Reference: Kozlowski LP. Proteome-pI 2.0: Proteome Isoelectric Point Database Update. Nucleic Acids Res. 2021, doi: 10.1093/nar/gkab944 | Contact: Lukasz P. Kozlowski |
