Tilletiopsis washingtonensis
Taxonomy: cellular organisms; Eukaryota; Opisthokonta; Fungi; Dikarya; Basidiomycota; Ustilaginomycotina; Exobasidiomycetes; Entylomatales; Entylomatales incertae sedis; Tilletiopsis
Average proteome isoelectric point is 7.07
Get precalculated fractions of proteins

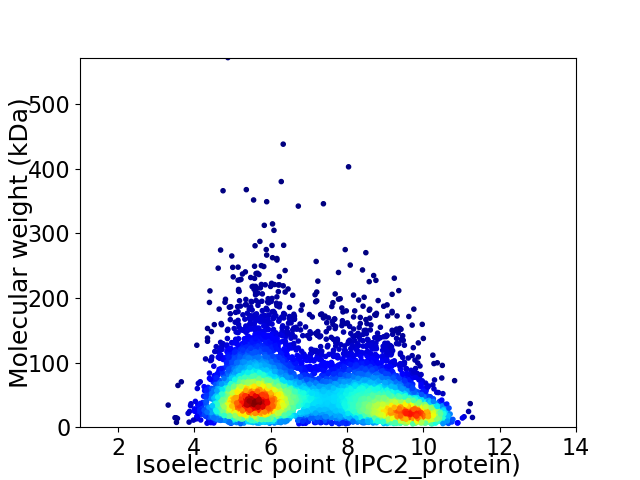
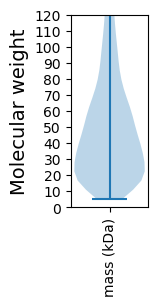
Virtual 2D-PAGE plot for 7007 proteins (isoelectric point calculated using IPC2_protein)
Get csv file with sequences according to given criteria:
* You can choose from 21 different methods for calculating isoelectric point
Summary statistics related to proteome-wise predictions


Protein with the lowest isoelectric point:
>tr|A0A316Z1M4|A0A316Z1M4_9BASI E3 ubiquitin ligase complex SCF subunit OS=Tilletiopsis washingtonensis OX=58919 GN=FA09DRAFT_312931 PE=3 SV=1
MM1 pKa = 7.11LHH3 pKa = 6.55LWHH6 pKa = 6.43VVSAFALLLLQARR19 pKa = 11.84ALEE22 pKa = 4.32FAFTTFSCNEE32 pKa = 3.37VRR34 pKa = 11.84FTYY37 pKa = 10.95ALDD40 pKa = 3.35QNTWEE45 pKa = 4.14RR46 pKa = 11.84QANVLLINYY55 pKa = 9.21RR56 pKa = 11.84DD57 pKa = 3.64EE58 pKa = 4.43TIAAVDD64 pKa = 3.52INSPSGTGSFDD75 pKa = 3.15PTVITEE81 pKa = 4.1AARR84 pKa = 11.84YY85 pKa = 9.39DD86 pKa = 3.52FTVALGSDD94 pKa = 3.47ACDD97 pKa = 3.22VFATDD102 pKa = 4.75GACFEE107 pKa = 4.61AGRR110 pKa = 11.84NQLYY114 pKa = 10.75ALTISQQATCDD125 pKa = 3.67GEE127 pKa = 4.64GTGDD131 pKa = 4.62ADD133 pKa = 3.66ATSNLPADD141 pKa = 4.67GAQSSEE147 pKa = 3.97ADD149 pKa = 3.49EE150 pKa = 5.38ADD152 pKa = 3.6NQALNSAVVPDD163 pKa = 5.77DD164 pKa = 3.46IAHH167 pKa = 6.21TAGAVTVSVGSAEE180 pKa = 4.11ASSTGSGAQTATPTSSAAPTTATLIPLPLSSTAPAANAASARR222 pKa = 11.84AGWSGAAVLAALVLAAAVV240 pKa = 3.46
MM1 pKa = 7.11LHH3 pKa = 6.55LWHH6 pKa = 6.43VVSAFALLLLQARR19 pKa = 11.84ALEE22 pKa = 4.32FAFTTFSCNEE32 pKa = 3.37VRR34 pKa = 11.84FTYY37 pKa = 10.95ALDD40 pKa = 3.35QNTWEE45 pKa = 4.14RR46 pKa = 11.84QANVLLINYY55 pKa = 9.21RR56 pKa = 11.84DD57 pKa = 3.64EE58 pKa = 4.43TIAAVDD64 pKa = 3.52INSPSGTGSFDD75 pKa = 3.15PTVITEE81 pKa = 4.1AARR84 pKa = 11.84YY85 pKa = 9.39DD86 pKa = 3.52FTVALGSDD94 pKa = 3.47ACDD97 pKa = 3.22VFATDD102 pKa = 4.75GACFEE107 pKa = 4.61AGRR110 pKa = 11.84NQLYY114 pKa = 10.75ALTISQQATCDD125 pKa = 3.67GEE127 pKa = 4.64GTGDD131 pKa = 4.62ADD133 pKa = 3.66ATSNLPADD141 pKa = 4.67GAQSSEE147 pKa = 3.97ADD149 pKa = 3.49EE150 pKa = 5.38ADD152 pKa = 3.6NQALNSAVVPDD163 pKa = 5.77DD164 pKa = 3.46IAHH167 pKa = 6.21TAGAVTVSVGSAEE180 pKa = 4.11ASSTGSGAQTATPTSSAAPTTATLIPLPLSSTAPAANAASARR222 pKa = 11.84AGWSGAAVLAALVLAAAVV240 pKa = 3.46
Molecular weight: 24.41 kDa
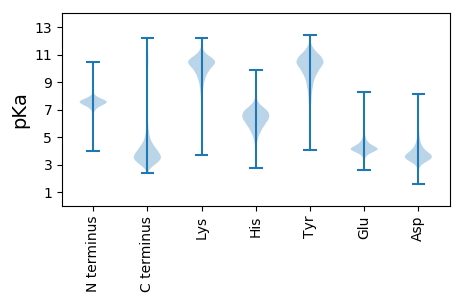
Isoelectric point according different methods:
Protein with the highest isoelectric point:
>tr|A0A316Z7X5|A0A316Z7X5_9BASI Uncharacterized protein OS=Tilletiopsis washingtonensis OX=58919 GN=FA09DRAFT_30911 PE=4 SV=1
MM1 pKa = 7.74PRR3 pKa = 11.84RR4 pKa = 11.84TSLTRR9 pKa = 11.84LLPQGTLSRR18 pKa = 11.84APHH21 pKa = 4.91RR22 pKa = 11.84TPRR25 pKa = 11.84RR26 pKa = 11.84RR27 pKa = 11.84HH28 pKa = 5.05PTLLPRR34 pKa = 11.84RR35 pKa = 11.84STRR38 pKa = 11.84SRR40 pKa = 11.84TLPTPSCVPPRR51 pKa = 11.84RR52 pKa = 11.84PRR54 pKa = 11.84AASPPPPRR62 pKa = 11.84LPRR65 pKa = 11.84TASRR69 pKa = 11.84RR70 pKa = 11.84LRR72 pKa = 11.84RR73 pKa = 11.84QSSRR77 pKa = 11.84ARR79 pKa = 11.84ATSHH83 pKa = 6.12RR84 pKa = 11.84RR85 pKa = 11.84QRR87 pKa = 11.84TASSARR93 pKa = 11.84RR94 pKa = 11.84RR95 pKa = 11.84RR96 pKa = 11.84ASTPRR101 pKa = 11.84RR102 pKa = 11.84RR103 pKa = 11.84RR104 pKa = 11.84VTTSRR109 pKa = 11.84ASSARR114 pKa = 11.84SRR116 pKa = 11.84WHH118 pKa = 6.21GRR120 pKa = 11.84SPMPVAMCKK129 pKa = 9.6PAA131 pKa = 4.87
MM1 pKa = 7.74PRR3 pKa = 11.84RR4 pKa = 11.84TSLTRR9 pKa = 11.84LLPQGTLSRR18 pKa = 11.84APHH21 pKa = 4.91RR22 pKa = 11.84TPRR25 pKa = 11.84RR26 pKa = 11.84RR27 pKa = 11.84HH28 pKa = 5.05PTLLPRR34 pKa = 11.84RR35 pKa = 11.84STRR38 pKa = 11.84SRR40 pKa = 11.84TLPTPSCVPPRR51 pKa = 11.84RR52 pKa = 11.84PRR54 pKa = 11.84AASPPPPRR62 pKa = 11.84LPRR65 pKa = 11.84TASRR69 pKa = 11.84RR70 pKa = 11.84LRR72 pKa = 11.84RR73 pKa = 11.84QSSRR77 pKa = 11.84ARR79 pKa = 11.84ATSHH83 pKa = 6.12RR84 pKa = 11.84RR85 pKa = 11.84QRR87 pKa = 11.84TASSARR93 pKa = 11.84RR94 pKa = 11.84RR95 pKa = 11.84RR96 pKa = 11.84ASTPRR101 pKa = 11.84RR102 pKa = 11.84RR103 pKa = 11.84RR104 pKa = 11.84VTTSRR109 pKa = 11.84ASSARR114 pKa = 11.84SRR116 pKa = 11.84WHH118 pKa = 6.21GRR120 pKa = 11.84SPMPVAMCKK129 pKa = 9.6PAA131 pKa = 4.87
Molecular weight: 15.08 kDa
Isoelectric point according different methods:
Peptides (in silico digests for buttom-up proteomics)
Below you can find in silico digests of the whole proteome with Trypsin, Chymotrypsin, Trypsin+LysC, LysN, ArgC proteases suitable for different mass spec machines.| Try ESI |
 |
|---|
| ChTry ESI |
 |
|---|
| ArgC ESI |
 |
|---|
| LysN ESI |
 |
|---|
| TryLysC ESI |
 |
|---|
| Try MALDI |
 |
|---|
| ChTry MALDI |
 |
|---|
| ArgC MALDI |
 |
|---|
| LysN MALDI |
 |
|---|
| TryLysC MALDI |
 |
|---|
| Try LTQ |
 |
|---|
| ChTry LTQ |
 |
|---|
| ArgC LTQ |
 |
|---|
| LysN LTQ |
 |
|---|
| TryLysC LTQ |
 |
|---|
| Try MSlow |
 |
|---|
| ChTry MSlow |
 |
|---|
| ArgC MSlow |
 |
|---|
| LysN MSlow |
 |
|---|
| TryLysC MSlow |
 |
|---|
| Try MShigh |
 |
|---|
| ChTry MShigh |
 |
|---|
| ArgC MShigh |
 |
|---|
| LysN MShigh |
 |
|---|
| TryLysC MShigh |
 |
|---|
General Statistics
Number of major isoforms |
Number of additional isoforms |
Number of all proteins |
Number of amino acids |
Min. Seq. Length |
Max. Seq. Length |
Avg. Seq. Length |
Avg. Mol. Weight |
|---|---|---|---|---|---|---|---|
3617120 |
49 |
5324 |
516.2 |
55.4 |
Amino acid frequency
Ala |
Cys |
Asp |
Glu |
Phe |
Gly |
His |
Ile |
Lys |
Leu |
|---|---|---|---|---|---|---|---|---|---|
14.01 ± 0.049 | 1.152 ± 0.014 |
5.126 ± 0.02 | 5.888 ± 0.026 |
2.843 ± 0.018 | 7.537 ± 0.025 |
2.386 ± 0.012 | 3.04 ± 0.02 |
3.36 ± 0.025 | 9.263 ± 0.032 |
Met |
Asn |
Gln |
Pro |
Arg |
Ser |
Thr |
Val |
Trp |
Tyr |
|---|---|---|---|---|---|---|---|---|---|
1.854 ± 0.009 | 2.139 ± 0.016 |
6.834 ± 0.035 | 3.886 ± 0.024 |
7.766 ± 0.03 | 8.973 ± 0.043 |
5.024 ± 0.019 | 5.767 ± 0.021 |
1.235 ± 0.009 | 1.919 ± 0.015 |
Most of the basic statistics you can see at this page can be downloaded from this CSV file
Proteome-pI is available under Creative Commons Attribution-NoDerivs license, for more details see here
| Reference: Kozlowski LP. Proteome-pI 2.0: Proteome Isoelectric Point Database Update. Nucleic Acids Res. 2021, doi: 10.1093/nar/gkab944 | Contact: Lukasz P. Kozlowski |
