Saccharophagus degradans (strain 2-40 / ATCC 43961 / DSM 17024)
Taxonomy: cellular organisms; Bacteria; Proteobacteria; Gammaproteobacteria; Cellvibrionales; Cellvibrionaceae; Saccharophagus; Saccharophagus degradans
Average proteome isoelectric point is 6.11
Get precalculated fractions of proteins

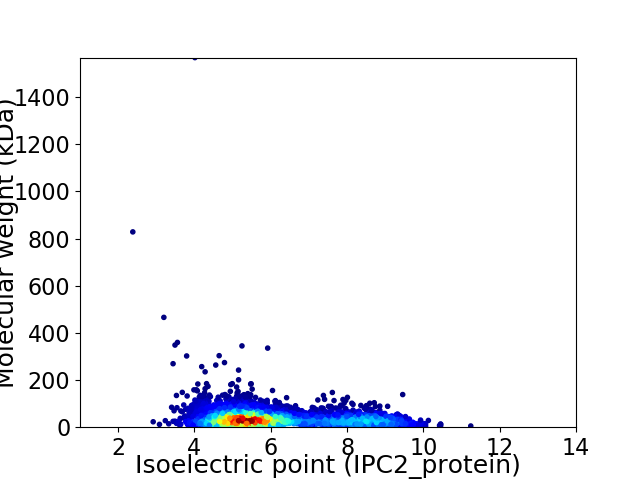
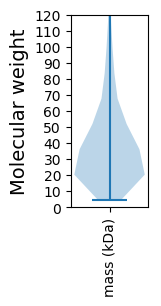
Virtual 2D-PAGE plot for 3999 proteins (isoelectric point calculated using IPC2_protein)
Get csv file with sequences according to given criteria:
* You can choose from 21 different methods for calculating isoelectric point
Summary statistics related to proteome-wise predictions


Protein with the lowest isoelectric point:
>tr|Q21PR3|Q21PR3_SACD2 S-(hydroxymethyl)glutathione dehydrogenase OS=Saccharophagus degradans (strain 2-40 / ATCC 43961 / DSM 17024) OX=203122 GN=Sde_0052 PE=3 SV=1
MM1 pKa = 6.23QHH3 pKa = 6.58HH4 pKa = 6.79YY5 pKa = 11.2KK6 pKa = 10.75LILPLTIAALASACGSGGDD25 pKa = 4.87DD26 pKa = 4.55GGDD29 pKa = 3.37SSGGSSSKK37 pKa = 9.99YY38 pKa = 10.3VYY40 pKa = 9.69MSTYY44 pKa = 9.09SSEE47 pKa = 3.81VGRR50 pKa = 11.84FVDD53 pKa = 3.75SAVGGVEE60 pKa = 3.87YY61 pKa = 10.76CQVLFNVRR69 pKa = 11.84NLDD72 pKa = 3.59DD73 pKa = 5.62SIDD76 pKa = 3.6AEE78 pKa = 5.33RR79 pKa = 11.84IDD81 pKa = 3.46QCGITDD87 pKa = 3.49SDD89 pKa = 3.92GSFSYY94 pKa = 9.92TLSVQGTEE102 pKa = 4.63DD103 pKa = 4.61LINPVLDD110 pKa = 3.74GDD112 pKa = 4.35GLQGRR117 pKa = 11.84QSAIIDD123 pKa = 3.34SAIRR127 pKa = 11.84FNVRR131 pKa = 11.84GIQLPDD137 pKa = 3.35VPVDD141 pKa = 3.6QLITPLSFSADD152 pKa = 3.14NSLDD156 pKa = 3.29QTAINVARR164 pKa = 11.84LLVSLDD170 pKa = 3.61SNNNLEE176 pKa = 4.27DD177 pKa = 4.61GIYY180 pKa = 10.16ISGDD184 pKa = 3.31DD185 pKa = 3.89FSNNILDD192 pKa = 4.44FGADD196 pKa = 3.33SEE198 pKa = 4.9VFATAAQVTLNEE210 pKa = 4.38AEE212 pKa = 4.18LTLAAEE218 pKa = 4.85DD219 pKa = 3.9EE220 pKa = 5.03VITHH224 pKa = 5.45VNEE227 pKa = 4.18SLSNLTQLAGTWVFANNSQQSFVQVSLFSDD257 pKa = 4.04GTYY260 pKa = 8.86THH262 pKa = 7.05IEE264 pKa = 4.1KK265 pKa = 10.58GDD267 pKa = 3.97EE268 pKa = 3.9IDD270 pKa = 3.59PSGMEE275 pKa = 3.74WGSYY279 pKa = 6.6TLNNGEE285 pKa = 4.36ITFKK289 pKa = 10.91AYY291 pKa = 9.56TDD293 pKa = 3.51NNGAIGLIDD302 pKa = 4.11SPLGSTLTTPTTLGYY317 pKa = 10.6SLSEE321 pKa = 4.22DD322 pKa = 3.99TNTLTLVDD330 pKa = 4.19GNEE333 pKa = 4.14SFDD336 pKa = 3.89LVRR339 pKa = 11.84AANITDD345 pKa = 4.23SIVGTWKK352 pKa = 10.23PKK354 pKa = 9.09YY355 pKa = 8.81KK356 pKa = 9.89TRR358 pKa = 11.84AYY360 pKa = 10.05YY361 pKa = 9.85ISLSFFEE368 pKa = 4.63NGLYY372 pKa = 10.29SHH374 pKa = 7.1GEE376 pKa = 3.82LGDD379 pKa = 3.7ADD381 pKa = 4.23EE382 pKa = 5.44PDD384 pKa = 4.57GIEE387 pKa = 4.16IGQYY391 pKa = 10.69DD392 pKa = 4.68LNSSTGRR399 pKa = 11.84LIPTLYY405 pKa = 10.78VDD407 pKa = 4.13TNGSTGLSDD416 pKa = 3.58AVNEE420 pKa = 4.5GEE422 pKa = 4.33VLTVEE427 pKa = 4.32VNGDD431 pKa = 3.32EE432 pKa = 4.19LTFNGEE438 pKa = 4.25MVFVRR443 pKa = 11.84QQ444 pKa = 3.74
MM1 pKa = 6.23QHH3 pKa = 6.58HH4 pKa = 6.79YY5 pKa = 11.2KK6 pKa = 10.75LILPLTIAALASACGSGGDD25 pKa = 4.87DD26 pKa = 4.55GGDD29 pKa = 3.37SSGGSSSKK37 pKa = 9.99YY38 pKa = 10.3VYY40 pKa = 9.69MSTYY44 pKa = 9.09SSEE47 pKa = 3.81VGRR50 pKa = 11.84FVDD53 pKa = 3.75SAVGGVEE60 pKa = 3.87YY61 pKa = 10.76CQVLFNVRR69 pKa = 11.84NLDD72 pKa = 3.59DD73 pKa = 5.62SIDD76 pKa = 3.6AEE78 pKa = 5.33RR79 pKa = 11.84IDD81 pKa = 3.46QCGITDD87 pKa = 3.49SDD89 pKa = 3.92GSFSYY94 pKa = 9.92TLSVQGTEE102 pKa = 4.63DD103 pKa = 4.61LINPVLDD110 pKa = 3.74GDD112 pKa = 4.35GLQGRR117 pKa = 11.84QSAIIDD123 pKa = 3.34SAIRR127 pKa = 11.84FNVRR131 pKa = 11.84GIQLPDD137 pKa = 3.35VPVDD141 pKa = 3.6QLITPLSFSADD152 pKa = 3.14NSLDD156 pKa = 3.29QTAINVARR164 pKa = 11.84LLVSLDD170 pKa = 3.61SNNNLEE176 pKa = 4.27DD177 pKa = 4.61GIYY180 pKa = 10.16ISGDD184 pKa = 3.31DD185 pKa = 3.89FSNNILDD192 pKa = 4.44FGADD196 pKa = 3.33SEE198 pKa = 4.9VFATAAQVTLNEE210 pKa = 4.38AEE212 pKa = 4.18LTLAAEE218 pKa = 4.85DD219 pKa = 3.9EE220 pKa = 5.03VITHH224 pKa = 5.45VNEE227 pKa = 4.18SLSNLTQLAGTWVFANNSQQSFVQVSLFSDD257 pKa = 4.04GTYY260 pKa = 8.86THH262 pKa = 7.05IEE264 pKa = 4.1KK265 pKa = 10.58GDD267 pKa = 3.97EE268 pKa = 3.9IDD270 pKa = 3.59PSGMEE275 pKa = 3.74WGSYY279 pKa = 6.6TLNNGEE285 pKa = 4.36ITFKK289 pKa = 10.91AYY291 pKa = 9.56TDD293 pKa = 3.51NNGAIGLIDD302 pKa = 4.11SPLGSTLTTPTTLGYY317 pKa = 10.6SLSEE321 pKa = 4.22DD322 pKa = 3.99TNTLTLVDD330 pKa = 4.19GNEE333 pKa = 4.14SFDD336 pKa = 3.89LVRR339 pKa = 11.84AANITDD345 pKa = 4.23SIVGTWKK352 pKa = 10.23PKK354 pKa = 9.09YY355 pKa = 8.81KK356 pKa = 9.89TRR358 pKa = 11.84AYY360 pKa = 10.05YY361 pKa = 9.85ISLSFFEE368 pKa = 4.63NGLYY372 pKa = 10.29SHH374 pKa = 7.1GEE376 pKa = 3.82LGDD379 pKa = 3.7ADD381 pKa = 4.23EE382 pKa = 5.44PDD384 pKa = 4.57GIEE387 pKa = 4.16IGQYY391 pKa = 10.69DD392 pKa = 4.68LNSSTGRR399 pKa = 11.84LIPTLYY405 pKa = 10.78VDD407 pKa = 4.13TNGSTGLSDD416 pKa = 3.58AVNEE420 pKa = 4.5GEE422 pKa = 4.33VLTVEE427 pKa = 4.32VNGDD431 pKa = 3.32EE432 pKa = 4.19LTFNGEE438 pKa = 4.25MVFVRR443 pKa = 11.84QQ444 pKa = 3.74
Molecular weight: 47.6 kDa
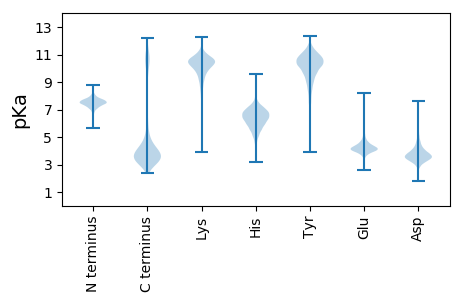
Isoelectric point according different methods:
Protein with the highest isoelectric point:
>tr|Q21DP3|Q21DP3_SACD2 Uncharacterized protein OS=Saccharophagus degradans (strain 2-40 / ATCC 43961 / DSM 17024) OX=203122 GN=Sde_3931 PE=4 SV=1
MM1 pKa = 7.45KK2 pKa = 9.51RR3 pKa = 11.84TFQPSVLKK11 pKa = 10.49RR12 pKa = 11.84KK13 pKa = 7.97RR14 pKa = 11.84THH16 pKa = 5.89GFRR19 pKa = 11.84ARR21 pKa = 11.84MATANGRR28 pKa = 11.84KK29 pKa = 8.91VLSRR33 pKa = 11.84RR34 pKa = 11.84RR35 pKa = 11.84AKK37 pKa = 10.44GRR39 pKa = 11.84ARR41 pKa = 11.84LSAA44 pKa = 3.91
MM1 pKa = 7.45KK2 pKa = 9.51RR3 pKa = 11.84TFQPSVLKK11 pKa = 10.49RR12 pKa = 11.84KK13 pKa = 7.97RR14 pKa = 11.84THH16 pKa = 5.89GFRR19 pKa = 11.84ARR21 pKa = 11.84MATANGRR28 pKa = 11.84KK29 pKa = 8.91VLSRR33 pKa = 11.84RR34 pKa = 11.84RR35 pKa = 11.84AKK37 pKa = 10.44GRR39 pKa = 11.84ARR41 pKa = 11.84LSAA44 pKa = 3.91
Molecular weight: 5.11 kDa
Isoelectric point according different methods:
Peptides (in silico digests for buttom-up proteomics)
Below you can find in silico digests of the whole proteome with Trypsin, Chymotrypsin, Trypsin+LysC, LysN, ArgC proteases suitable for different mass spec machines.| Try ESI |
 |
|---|
| ChTry ESI |
 |
|---|
| ArgC ESI |
 |
|---|
| LysN ESI |
 |
|---|
| TryLysC ESI |
 |
|---|
| Try MALDI |
 |
|---|
| ChTry MALDI |
 |
|---|
| ArgC MALDI |
 |
|---|
| LysN MALDI |
 |
|---|
| TryLysC MALDI |
 |
|---|
| Try LTQ |
 |
|---|
| ChTry LTQ |
 |
|---|
| ArgC LTQ |
 |
|---|
| LysN LTQ |
 |
|---|
| TryLysC LTQ |
 |
|---|
| Try MSlow |
 |
|---|
| ChTry MSlow |
 |
|---|
| ArgC MSlow |
 |
|---|
| LysN MSlow |
 |
|---|
| TryLysC MSlow |
 |
|---|
| Try MShigh |
 |
|---|
| ChTry MShigh |
 |
|---|
| ArgC MShigh |
 |
|---|
| LysN MShigh |
 |
|---|
| TryLysC MShigh |
 |
|---|
General Statistics
Number of major isoforms |
Number of additional isoforms |
Number of all proteins |
Number of amino acids |
Min. Seq. Length |
Max. Seq. Length |
Avg. Seq. Length |
Avg. Mol. Weight |
|---|---|---|---|---|---|---|---|
0 |
1456122 |
38 |
14609 |
364.1 |
40.13 |
Amino acid frequency
Ala |
Cys |
Asp |
Glu |
Phe |
Gly |
His |
Ile |
Lys |
Leu |
|---|---|---|---|---|---|---|---|---|---|
9.549 ± 0.04 | 1.028 ± 0.016 |
5.584 ± 0.048 | 6.098 ± 0.043 |
4.032 ± 0.029 | 7.085 ± 0.037 |
2.102 ± 0.023 | 5.95 ± 0.032 |
4.877 ± 0.055 | 9.816 ± 0.046 |
Met |
Asn |
Gln |
Pro |
Arg |
Ser |
Thr |
Val |
Trp |
Tyr |
|---|---|---|---|---|---|---|---|---|---|
2.173 ± 0.026 | 4.728 ± 0.039 |
4.091 ± 0.026 | 4.135 ± 0.031 |
4.448 ± 0.041 | 6.897 ± 0.063 |
5.74 ± 0.048 | 7.105 ± 0.042 |
1.358 ± 0.019 | 3.205 ± 0.024 |
Most of the basic statistics you can see at this page can be downloaded from this CSV file
Proteome-pI is available under Creative Commons Attribution-NoDerivs license, for more details see here
| Reference: Kozlowski LP. Proteome-pI 2.0: Proteome Isoelectric Point Database Update. Nucleic Acids Res. 2021, doi: 10.1093/nar/gkab944 | Contact: Lukasz P. Kozlowski |
