Microvirga lotononidis
Taxonomy: cellular organisms; Bacteria; Proteobacteria; Alphaproteobacteria; Hyphomicrobiales; Methylobacteriaceae; Microvirga
Average proteome isoelectric point is 6.77
Get precalculated fractions of proteins

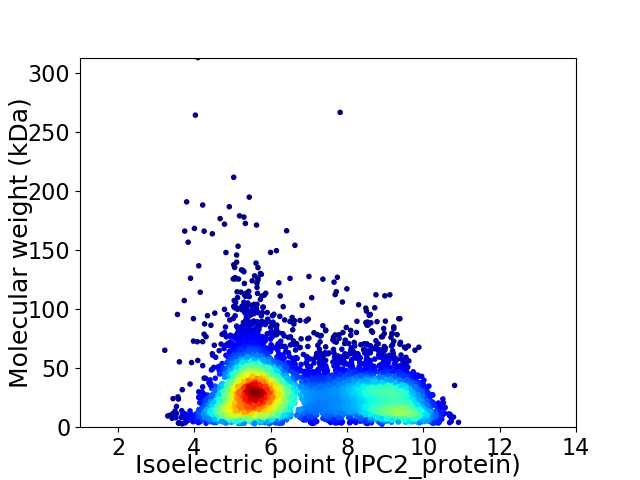
Virtual 2D-PAGE plot for 6918 proteins (isoelectric point calculated using IPC2_protein)
Get csv file with sequences according to given criteria:
* You can choose from 21 different methods for calculating isoelectric point
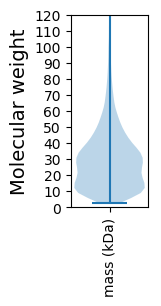
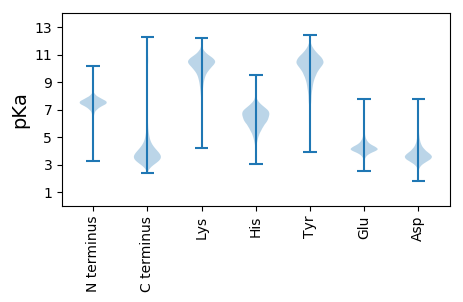
Summary statistics related to proteome-wise predictions


Protein with the lowest isoelectric point:
>tr|I4YX74|I4YX74_9RHIZ Uncharacterized protein OS=Microvirga lotononidis OX=864069 GN=MicloDRAFT_00027040 PE=4 SV=1
MM1 pKa = 7.81AIFKK5 pKa = 10.27AFNAAGVGFDD15 pKa = 3.49MSSTNSSGWAFIGAHH30 pKa = 6.22PSVTTDD36 pKa = 3.38LVYY39 pKa = 11.15DD40 pKa = 3.76NGTVAEE46 pKa = 4.34FEE48 pKa = 4.47VDD50 pKa = 3.73GSPLVDD56 pKa = 3.74YY57 pKa = 7.1FTARR61 pKa = 11.84YY62 pKa = 8.29WSDD65 pKa = 3.42GYY67 pKa = 9.05TVIIDD72 pKa = 3.57DD73 pKa = 5.65LYY75 pKa = 11.19YY76 pKa = 10.55EE77 pKa = 4.56NNGADD82 pKa = 3.17ILTIQDD88 pKa = 3.52LDD90 pKa = 4.01LYY92 pKa = 8.13TTVDD96 pKa = 3.47ALQGYY101 pKa = 8.6AWYY104 pKa = 10.78VNLNAGHH111 pKa = 6.53DD112 pKa = 3.66TFYY115 pKa = 11.54GNDD118 pKa = 3.42YY119 pKa = 11.04DD120 pKa = 4.71DD121 pKa = 6.27LIRR124 pKa = 11.84AGAGNDD130 pKa = 3.13VVYY133 pKa = 10.17AYY135 pKa = 10.54DD136 pKa = 4.36GDD138 pKa = 4.64DD139 pKa = 3.43IVYY142 pKa = 10.55GDD144 pKa = 4.7AGADD148 pKa = 3.5DD149 pKa = 6.21LYY151 pKa = 11.5GSWGDD156 pKa = 3.53DD157 pKa = 3.34DD158 pKa = 6.43LYY160 pKa = 11.39GGTGRR165 pKa = 11.84DD166 pKa = 3.42ILNGGAGSDD175 pKa = 3.97YY176 pKa = 11.3LNGGADD182 pKa = 3.68NDD184 pKa = 4.09EE185 pKa = 4.3LTGGSGKK192 pKa = 10.51DD193 pKa = 3.13YY194 pKa = 10.83FVFDD198 pKa = 3.93TRR200 pKa = 11.84PSRR203 pKa = 11.84TNVDD207 pKa = 3.73RR208 pKa = 11.84IVDD211 pKa = 4.22FRR213 pKa = 11.84PVDD216 pKa = 3.63DD217 pKa = 5.71TIMLDD222 pKa = 3.32NQVFTRR228 pKa = 11.84VGRR231 pKa = 11.84DD232 pKa = 2.82GWLSGGAFTTGSGARR247 pKa = 11.84DD248 pKa = 3.26SSDD251 pKa = 3.45RR252 pKa = 11.84IIYY255 pKa = 9.28NKK257 pKa = 8.08QTGALLYY264 pKa = 10.64DD265 pKa = 3.95PDD267 pKa = 6.31GIGGAAAIKK276 pKa = 9.57FAQLNKK282 pKa = 10.6GLTLTKK288 pKa = 10.57ADD290 pKa = 4.09FFLLL294 pKa = 3.91
MM1 pKa = 7.81AIFKK5 pKa = 10.27AFNAAGVGFDD15 pKa = 3.49MSSTNSSGWAFIGAHH30 pKa = 6.22PSVTTDD36 pKa = 3.38LVYY39 pKa = 11.15DD40 pKa = 3.76NGTVAEE46 pKa = 4.34FEE48 pKa = 4.47VDD50 pKa = 3.73GSPLVDD56 pKa = 3.74YY57 pKa = 7.1FTARR61 pKa = 11.84YY62 pKa = 8.29WSDD65 pKa = 3.42GYY67 pKa = 9.05TVIIDD72 pKa = 3.57DD73 pKa = 5.65LYY75 pKa = 11.19YY76 pKa = 10.55EE77 pKa = 4.56NNGADD82 pKa = 3.17ILTIQDD88 pKa = 3.52LDD90 pKa = 4.01LYY92 pKa = 8.13TTVDD96 pKa = 3.47ALQGYY101 pKa = 8.6AWYY104 pKa = 10.78VNLNAGHH111 pKa = 6.53DD112 pKa = 3.66TFYY115 pKa = 11.54GNDD118 pKa = 3.42YY119 pKa = 11.04DD120 pKa = 4.71DD121 pKa = 6.27LIRR124 pKa = 11.84AGAGNDD130 pKa = 3.13VVYY133 pKa = 10.17AYY135 pKa = 10.54DD136 pKa = 4.36GDD138 pKa = 4.64DD139 pKa = 3.43IVYY142 pKa = 10.55GDD144 pKa = 4.7AGADD148 pKa = 3.5DD149 pKa = 6.21LYY151 pKa = 11.5GSWGDD156 pKa = 3.53DD157 pKa = 3.34DD158 pKa = 6.43LYY160 pKa = 11.39GGTGRR165 pKa = 11.84DD166 pKa = 3.42ILNGGAGSDD175 pKa = 3.97YY176 pKa = 11.3LNGGADD182 pKa = 3.68NDD184 pKa = 4.09EE185 pKa = 4.3LTGGSGKK192 pKa = 10.51DD193 pKa = 3.13YY194 pKa = 10.83FVFDD198 pKa = 3.93TRR200 pKa = 11.84PSRR203 pKa = 11.84TNVDD207 pKa = 3.73RR208 pKa = 11.84IVDD211 pKa = 4.22FRR213 pKa = 11.84PVDD216 pKa = 3.63DD217 pKa = 5.71TIMLDD222 pKa = 3.32NQVFTRR228 pKa = 11.84VGRR231 pKa = 11.84DD232 pKa = 2.82GWLSGGAFTTGSGARR247 pKa = 11.84DD248 pKa = 3.26SSDD251 pKa = 3.45RR252 pKa = 11.84IIYY255 pKa = 9.28NKK257 pKa = 8.08QTGALLYY264 pKa = 10.64DD265 pKa = 3.95PDD267 pKa = 6.31GIGGAAAIKK276 pKa = 9.57FAQLNKK282 pKa = 10.6GLTLTKK288 pKa = 10.57ADD290 pKa = 4.09FFLLL294 pKa = 3.91
Molecular weight: 31.71 kDa
Isoelectric point according different methods:
Protein with the highest isoelectric point:
>tr|I4Z232|I4Z232_9RHIZ Uncharacterized protein OS=Microvirga lotononidis OX=864069 GN=MicloDRAFT_00010790 PE=4 SV=1
MM1 pKa = 7.83RR2 pKa = 11.84FRR4 pKa = 11.84RR5 pKa = 11.84NRR7 pKa = 11.84LPPRR11 pKa = 11.84LFALRR16 pKa = 11.84WILLGVTVLIVAALAVGATFF36 pKa = 4.78
MM1 pKa = 7.83RR2 pKa = 11.84FRR4 pKa = 11.84RR5 pKa = 11.84NRR7 pKa = 11.84LPPRR11 pKa = 11.84LFALRR16 pKa = 11.84WILLGVTVLIVAALAVGATFF36 pKa = 4.78
Molecular weight: 4.11 kDa
Isoelectric point according different methods:
Peptides (in silico digests for buttom-up proteomics)
Below you can find in silico digests of the whole proteome with Trypsin, Chymotrypsin, Trypsin+LysC, LysN, ArgC proteases suitable for different mass spec machines.| Try ESI |
 |
|---|
| ChTry ESI |
 |
|---|
| ArgC ESI |
 |
|---|
| LysN ESI |
 |
|---|
| TryLysC ESI |
 |
|---|
| Try MALDI |
 |
|---|
| ChTry MALDI |
 |
|---|
| ArgC MALDI |
 |
|---|
| LysN MALDI |
 |
|---|
| TryLysC MALDI |
 |
|---|
| Try LTQ |
 |
|---|
| ChTry LTQ |
 |
|---|
| ArgC LTQ |
 |
|---|
| LysN LTQ |
 |
|---|
| TryLysC LTQ |
 |
|---|
| Try MSlow |
 |
|---|
| ChTry MSlow |
 |
|---|
| ArgC MSlow |
 |
|---|
| LysN MSlow |
 |
|---|
| TryLysC MSlow |
 |
|---|
| Try MShigh |
 |
|---|
| ChTry MShigh |
 |
|---|
| ArgC MShigh |
 |
|---|
| LysN MShigh |
 |
|---|
| TryLysC MShigh |
 |
|---|
General Statistics
Number of major isoforms |
Number of additional isoforms |
Number of all proteins |
Number of amino acids |
Min. Seq. Length |
Max. Seq. Length |
Avg. Seq. Length |
Avg. Mol. Weight |
|---|---|---|---|---|---|---|---|
0 |
1985803 |
24 |
3056 |
287.0 |
31.27 |
Amino acid frequency
Ala |
Cys |
Asp |
Glu |
Phe |
Gly |
His |
Ile |
Lys |
Leu |
|---|---|---|---|---|---|---|---|---|---|
11.771 ± 0.037 | 0.807 ± 0.01 |
5.508 ± 0.026 | 5.757 ± 0.027 |
3.651 ± 0.02 | 8.437 ± 0.04 |
2.081 ± 0.015 | 5.236 ± 0.023 |
3.285 ± 0.023 | 10.223 ± 0.038 |
Met |
Asn |
Gln |
Pro |
Arg |
Ser |
Thr |
Val |
Trp |
Tyr |
|---|---|---|---|---|---|---|---|---|---|
2.369 ± 0.014 | 2.614 ± 0.02 |
5.336 ± 0.023 | 3.312 ± 0.019 |
7.42 ± 0.038 | 5.719 ± 0.027 |
5.386 ± 0.025 | 7.471 ± 0.022 |
1.377 ± 0.012 | 2.24 ± 0.016 |
Most of the basic statistics you can see at this page can be downloaded from this CSV file
Proteome-pI is available under Creative Commons Attribution-NoDerivs license, for more details see here
| Reference: Kozlowski LP. Proteome-pI 2.0: Proteome Isoelectric Point Database Update. Nucleic Acids Res. 2021, doi: 10.1093/nar/gkab944 | Contact: Lukasz P. Kozlowski |
