Haloarcula hispanica pleomorphic virus 3
Taxonomy: Viruses; Monodnaviria; Trapavirae; Saleviricota; Huolimaviricetes; Haloruvirales; Pleolipoviridae; Betapleolipovirus; Betapleolipovirus HHPV3
Average proteome isoelectric point is 4.99
Get precalculated fractions of proteins

Virtual 2D-PAGE plot for 17 proteins (isoelectric point calculated using IPC2_protein)
Get csv file with sequences according to given criteria:
* You can choose from 21 different methods for calculating isoelectric point
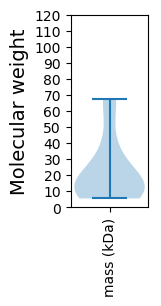
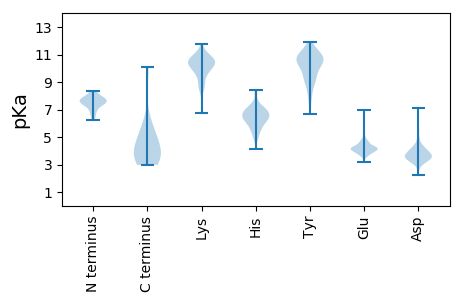
Summary statistics related to proteome-wise predictions


Protein with the lowest isoelectric point:
>tr|A0A1C8V5Y3|A0A1C8V5Y3_9VIRU Uncharacterized protein OS=Haloarcula hispanica pleomorphic virus 3 OX=1879051 PE=4 SV=1
MM1 pKa = 7.5AALAASPTMFGKK13 pKa = 9.89IDD15 pKa = 3.83IEE17 pKa = 4.21DD18 pKa = 3.8ALAGVIFTASAFVTNGIASISLLGYY43 pKa = 10.45DD44 pKa = 4.29LAASVFTVQGTSIDD58 pKa = 3.82LAFLLSLVALAMAYY72 pKa = 7.68ATNRR76 pKa = 11.84VNEE79 pKa = 4.26SRR81 pKa = 11.84NKK83 pKa = 10.3NYY85 pKa = 9.95QLDD88 pKa = 3.87TDD90 pKa = 4.62LVDD93 pKa = 3.32IAKK96 pKa = 10.58GSATVEE102 pKa = 4.21TYY104 pKa = 10.68LALGTLVIVLFTGLNILGAQDD125 pKa = 3.35IVVGSAAIGLTVVAVEE141 pKa = 3.67AAGYY145 pKa = 9.17YY146 pKa = 9.57VISYY150 pKa = 10.2LGG152 pKa = 3.24
MM1 pKa = 7.5AALAASPTMFGKK13 pKa = 9.89IDD15 pKa = 3.83IEE17 pKa = 4.21DD18 pKa = 3.8ALAGVIFTASAFVTNGIASISLLGYY43 pKa = 10.45DD44 pKa = 4.29LAASVFTVQGTSIDD58 pKa = 3.82LAFLLSLVALAMAYY72 pKa = 7.68ATNRR76 pKa = 11.84VNEE79 pKa = 4.26SRR81 pKa = 11.84NKK83 pKa = 10.3NYY85 pKa = 9.95QLDD88 pKa = 3.87TDD90 pKa = 4.62LVDD93 pKa = 3.32IAKK96 pKa = 10.58GSATVEE102 pKa = 4.21TYY104 pKa = 10.68LALGTLVIVLFTGLNILGAQDD125 pKa = 3.35IVVGSAAIGLTVVAVEE141 pKa = 3.67AAGYY145 pKa = 9.17YY146 pKa = 9.57VISYY150 pKa = 10.2LGG152 pKa = 3.24
Molecular weight: 15.63 kDa
Isoelectric point according different methods:
Protein with the highest isoelectric point:
>tr|A0A1C8V5Z2|A0A1C8V5Z2_9VIRU Uncharacterized protein OS=Haloarcula hispanica pleomorphic virus 3 OX=1879051 PE=4 SV=1
MM1 pKa = 7.34SRR3 pKa = 11.84SHH5 pKa = 6.95KK6 pKa = 10.07ANHH9 pKa = 6.33YY10 pKa = 6.72GTLVEE15 pKa = 4.69RR16 pKa = 11.84KK17 pKa = 8.94AAEE20 pKa = 4.35RR21 pKa = 11.84YY22 pKa = 10.16DD23 pKa = 4.4LDD25 pKa = 4.39LDD27 pKa = 3.64RR28 pKa = 11.84CSWHH32 pKa = 6.96DD33 pKa = 3.52AKK35 pKa = 11.02RR36 pKa = 11.84PDD38 pKa = 3.58GTPVEE43 pKa = 4.88IKK45 pKa = 10.56SAMHH49 pKa = 6.22RR50 pKa = 11.84HH51 pKa = 6.43ADD53 pKa = 3.76GQPGTFKK60 pKa = 11.04LYY62 pKa = 10.68DD63 pKa = 3.6RR64 pKa = 11.84YY65 pKa = 10.45HH66 pKa = 6.13RR67 pKa = 11.84RR68 pKa = 11.84LRR70 pKa = 11.84AEE72 pKa = 4.05NGWYY76 pKa = 10.3AFGVYY81 pKa = 8.82RR82 pKa = 11.84VRR84 pKa = 11.84GRR86 pKa = 11.84GIEE89 pKa = 3.94VLEE92 pKa = 3.82WEE94 pKa = 4.51IRR96 pKa = 11.84HH97 pKa = 6.05SSRR100 pKa = 11.84LPKK103 pKa = 10.15LDD105 pKa = 2.95WHH107 pKa = 6.83GGGIHH112 pKa = 7.4RR113 pKa = 11.84DD114 pKa = 3.22AKK116 pKa = 8.96QAKK119 pKa = 9.19IPVSEE124 pKa = 4.2LRR126 pKa = 11.84YY127 pKa = 10.11
MM1 pKa = 7.34SRR3 pKa = 11.84SHH5 pKa = 6.95KK6 pKa = 10.07ANHH9 pKa = 6.33YY10 pKa = 6.72GTLVEE15 pKa = 4.69RR16 pKa = 11.84KK17 pKa = 8.94AAEE20 pKa = 4.35RR21 pKa = 11.84YY22 pKa = 10.16DD23 pKa = 4.4LDD25 pKa = 4.39LDD27 pKa = 3.64RR28 pKa = 11.84CSWHH32 pKa = 6.96DD33 pKa = 3.52AKK35 pKa = 11.02RR36 pKa = 11.84PDD38 pKa = 3.58GTPVEE43 pKa = 4.88IKK45 pKa = 10.56SAMHH49 pKa = 6.22RR50 pKa = 11.84HH51 pKa = 6.43ADD53 pKa = 3.76GQPGTFKK60 pKa = 11.04LYY62 pKa = 10.68DD63 pKa = 3.6RR64 pKa = 11.84YY65 pKa = 10.45HH66 pKa = 6.13RR67 pKa = 11.84RR68 pKa = 11.84LRR70 pKa = 11.84AEE72 pKa = 4.05NGWYY76 pKa = 10.3AFGVYY81 pKa = 8.82RR82 pKa = 11.84VRR84 pKa = 11.84GRR86 pKa = 11.84GIEE89 pKa = 3.94VLEE92 pKa = 3.82WEE94 pKa = 4.51IRR96 pKa = 11.84HH97 pKa = 6.05SSRR100 pKa = 11.84LPKK103 pKa = 10.15LDD105 pKa = 2.95WHH107 pKa = 6.83GGGIHH112 pKa = 7.4RR113 pKa = 11.84DD114 pKa = 3.22AKK116 pKa = 8.96QAKK119 pKa = 9.19IPVSEE124 pKa = 4.2LRR126 pKa = 11.84YY127 pKa = 10.11
Molecular weight: 14.95 kDa
Isoelectric point according different methods:
Peptides (in silico digests for buttom-up proteomics)
Below you can find in silico digests of the whole proteome with Trypsin, Chymotrypsin, Trypsin+LysC, LysN, ArgC proteases suitable for different mass spec machines.| Try ESI |
 |
|---|
| ChTry ESI |
 |
|---|
| ArgC ESI |
 |
|---|
| LysN ESI |
 |
|---|
| TryLysC ESI |
 |
|---|
| Try MALDI |
 |
|---|
| ChTry MALDI |
 |
|---|
| ArgC MALDI |
 |
|---|
| LysN MALDI |
 |
|---|
| TryLysC MALDI |
 |
|---|
| Try LTQ |
 |
|---|
| ChTry LTQ |
 |
|---|
| ArgC LTQ |
 |
|---|
| LysN LTQ |
 |
|---|
| TryLysC LTQ |
 |
|---|
| Try MSlow |
 |
|---|
| ChTry MSlow |
 |
|---|
| ArgC MSlow |
 |
|---|
| LysN MSlow |
 |
|---|
| TryLysC MSlow |
 |
|---|
| Try MShigh |
 |
|---|
| ChTry MShigh |
 |
|---|
| ArgC MShigh |
 |
|---|
| LysN MShigh |
 |
|---|
| TryLysC MShigh |
 |
|---|
General Statistics
Number of major isoforms |
Number of additional isoforms |
Number of all proteins |
Number of amino acids |
Min. Seq. Length |
Max. Seq. Length |
Avg. Seq. Length |
Avg. Mol. Weight |
|---|---|---|---|---|---|---|---|
0 |
3367 |
47 |
613 |
198.1 |
22.09 |
Amino acid frequency
Ala |
Cys |
Asp |
Glu |
Phe |
Gly |
His |
Ile |
Lys |
Leu |
|---|---|---|---|---|---|---|---|---|---|
8.554 ± 0.698 | 0.743 ± 0.179 |
7.692 ± 0.45 | 8.108 ± 0.698 |
2.465 ± 0.287 | 7.722 ± 0.469 |
2.138 ± 0.36 | 5.227 ± 0.576 |
4.039 ± 0.352 | 7.069 ± 0.432 |
Met |
Asn |
Gln |
Pro |
Arg |
Ser |
Thr |
Val |
Trp |
Tyr |
|---|---|---|---|---|---|---|---|---|---|
1.782 ± 0.16 | 3.713 ± 0.55 |
4.544 ± 0.423 | 4.514 ± 0.504 |
6.207 ± 0.888 | 6.118 ± 0.711 |
6.801 ± 0.706 | 6.742 ± 0.438 |
1.544 ± 0.27 | 4.277 ± 0.337 |
Most of the basic statistics you can see at this page can be downloaded from this CSV file
Proteome-pI is available under Creative Commons Attribution-NoDerivs license, for more details see here
| Reference: Kozlowski LP. Proteome-pI 2.0: Proteome Isoelectric Point Database Update. Nucleic Acids Res. 2021, doi: 10.1093/nar/gkab944 | Contact: Lukasz P. Kozlowski |
