Cyanobium sp. PCC 7001
Taxonomy: cellular organisms; Bacteria; Terrabacteria group; Cyanobacteria/Melainabacteria group; Cyanobacteria; Synechococcales; Synechococcaceae; Cyanobium; unclassified Cyanobium
Average proteome isoelectric point is 6.73
Get precalculated fractions of proteins
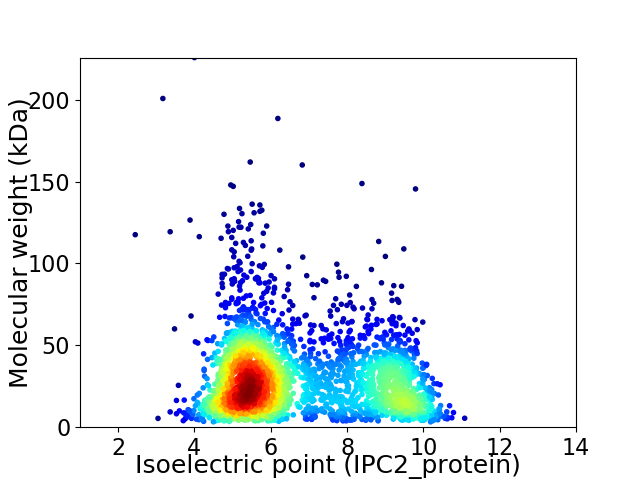
Virtual 2D-PAGE plot for 2762 proteins (isoelectric point calculated using IPC2_protein)
Get csv file with sequences according to given criteria:
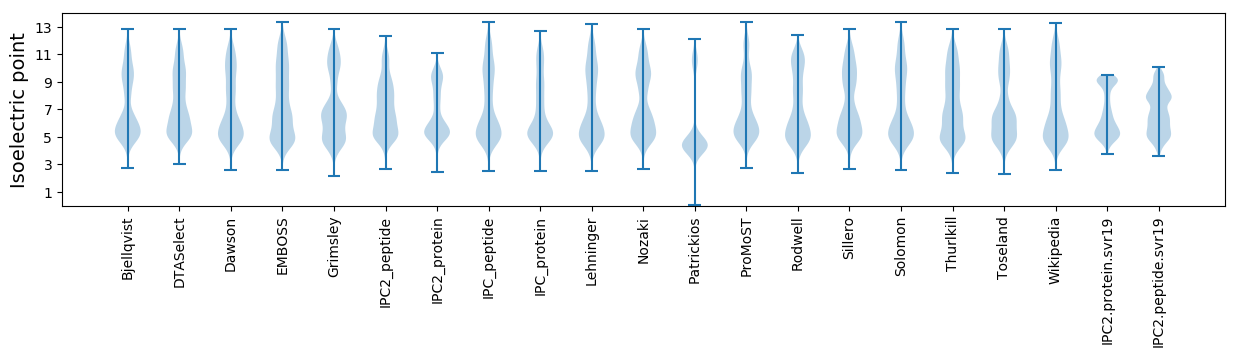
* You can choose from 21 different methods for calculating isoelectric point
Summary statistics related to proteome-wise predictions
Protein with the lowest isoelectric point:
>tr|B5IKG5|B5IKG5_9CYAN Uncharacterized protein OS=Cyanobium sp. PCC 7001 OX=180281 GN=CPCC7001_1821 PE=4 SV=1
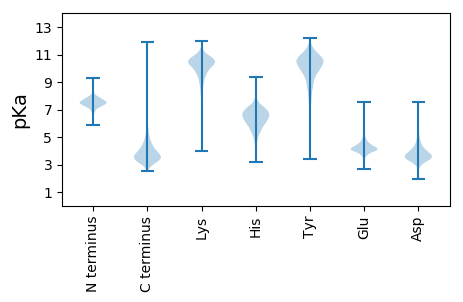
MM1 pKa = 7.8IDD3 pKa = 3.29VDD5 pKa = 5.29DD6 pKa = 6.33LIDD9 pKa = 4.39CGSVSTGTLRR19 pKa = 11.84SSDD22 pKa = 3.87LADD25 pKa = 3.9ALLGEE30 pKa = 4.52IDD32 pKa = 3.94RR33 pKa = 11.84LGLATHH39 pKa = 7.0APDD42 pKa = 4.33ALIHH46 pKa = 6.24AAQALACFSSPTVEE60 pKa = 4.87DD61 pKa = 4.64LPDD64 pKa = 3.6NMAEE68 pKa = 4.32TAGEE72 pKa = 4.37TVSDD76 pKa = 4.06MIDD79 pKa = 3.3WLNDD83 pKa = 3.36HH84 pKa = 7.1APDD87 pKa = 4.18GWCLQTLEE95 pKa = 4.82GDD97 pKa = 4.05GADD100 pKa = 5.14LLWQPVTLRR109 pKa = 11.84AQLQAAGSPWVQSEE123 pKa = 3.78WDD125 pKa = 3.48KK126 pKa = 11.35RR127 pKa = 11.84SQNDD131 pKa = 4.01AIDD134 pKa = 4.98DD135 pKa = 4.22IIEE138 pKa = 4.46RR139 pKa = 11.84FDD141 pKa = 4.07DD142 pKa = 4.45CPEE145 pKa = 4.02ALQDD149 pKa = 4.11FDD151 pKa = 3.72ISDD154 pKa = 3.6WVNVAEE160 pKa = 5.22CYY162 pKa = 9.91TGTLLRR168 pKa = 11.84RR169 pKa = 11.84WEE171 pKa = 4.08LQEE174 pKa = 3.66QSIRR178 pKa = 11.84ALFDD182 pKa = 4.47DD183 pKa = 4.49YY184 pKa = 11.34CDD186 pKa = 3.91QLGCTSALEE195 pKa = 4.23ALDD198 pKa = 3.99GQTIEE203 pKa = 5.67DD204 pKa = 4.49PDD206 pKa = 4.78DD207 pKa = 3.45FTAAYY212 pKa = 10.25VNLAMTWGAQCLLRR226 pKa = 11.84EE227 pKa = 4.55IDD229 pKa = 3.91PDD231 pKa = 3.7HH232 pKa = 6.78
MM1 pKa = 7.8IDD3 pKa = 3.29VDD5 pKa = 5.29DD6 pKa = 6.33LIDD9 pKa = 4.39CGSVSTGTLRR19 pKa = 11.84SSDD22 pKa = 3.87LADD25 pKa = 3.9ALLGEE30 pKa = 4.52IDD32 pKa = 3.94RR33 pKa = 11.84LGLATHH39 pKa = 7.0APDD42 pKa = 4.33ALIHH46 pKa = 6.24AAQALACFSSPTVEE60 pKa = 4.87DD61 pKa = 4.64LPDD64 pKa = 3.6NMAEE68 pKa = 4.32TAGEE72 pKa = 4.37TVSDD76 pKa = 4.06MIDD79 pKa = 3.3WLNDD83 pKa = 3.36HH84 pKa = 7.1APDD87 pKa = 4.18GWCLQTLEE95 pKa = 4.82GDD97 pKa = 4.05GADD100 pKa = 5.14LLWQPVTLRR109 pKa = 11.84AQLQAAGSPWVQSEE123 pKa = 3.78WDD125 pKa = 3.48KK126 pKa = 11.35RR127 pKa = 11.84SQNDD131 pKa = 4.01AIDD134 pKa = 4.98DD135 pKa = 4.22IIEE138 pKa = 4.46RR139 pKa = 11.84FDD141 pKa = 4.07DD142 pKa = 4.45CPEE145 pKa = 4.02ALQDD149 pKa = 4.11FDD151 pKa = 3.72ISDD154 pKa = 3.6WVNVAEE160 pKa = 5.22CYY162 pKa = 9.91TGTLLRR168 pKa = 11.84RR169 pKa = 11.84WEE171 pKa = 4.08LQEE174 pKa = 3.66QSIRR178 pKa = 11.84ALFDD182 pKa = 4.47DD183 pKa = 4.49YY184 pKa = 11.34CDD186 pKa = 3.91QLGCTSALEE195 pKa = 4.23ALDD198 pKa = 3.99GQTIEE203 pKa = 5.67DD204 pKa = 4.49PDD206 pKa = 4.78DD207 pKa = 3.45FTAAYY212 pKa = 10.25VNLAMTWGAQCLLRR226 pKa = 11.84EE227 pKa = 4.55IDD229 pKa = 3.91PDD231 pKa = 3.7HH232 pKa = 6.78
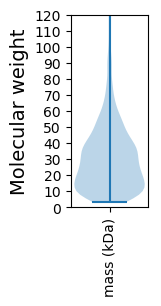
Molecular weight: 25.55 kDa
Isoelectric point according different methods:
Protein with the highest isoelectric point:
>tr|B5INV1|B5INV1_9CYAN 30S ribosomal protein S4 OS=Cyanobium sp. PCC 7001 OX=180281 GN=rpsD PE=3 SV=1
MM1 pKa = 7.56TKK3 pKa = 9.03RR4 pKa = 11.84TLEE7 pKa = 3.92GTSRR11 pKa = 11.84KK12 pKa = 9.24RR13 pKa = 11.84KK14 pKa = 7.95RR15 pKa = 11.84VSGFRR20 pKa = 11.84VRR22 pKa = 11.84MRR24 pKa = 11.84THH26 pKa = 5.95TGRR29 pKa = 11.84RR30 pKa = 11.84VIRR33 pKa = 11.84SRR35 pKa = 11.84RR36 pKa = 11.84RR37 pKa = 11.84RR38 pKa = 11.84GRR40 pKa = 11.84SRR42 pKa = 11.84LAVV45 pKa = 3.35
MM1 pKa = 7.56TKK3 pKa = 9.03RR4 pKa = 11.84TLEE7 pKa = 3.92GTSRR11 pKa = 11.84KK12 pKa = 9.24RR13 pKa = 11.84KK14 pKa = 7.95RR15 pKa = 11.84VSGFRR20 pKa = 11.84VRR22 pKa = 11.84MRR24 pKa = 11.84THH26 pKa = 5.95TGRR29 pKa = 11.84RR30 pKa = 11.84VIRR33 pKa = 11.84SRR35 pKa = 11.84RR36 pKa = 11.84RR37 pKa = 11.84RR38 pKa = 11.84GRR40 pKa = 11.84SRR42 pKa = 11.84LAVV45 pKa = 3.35
Molecular weight: 5.47 kDa
Isoelectric point according different methods:
Peptides (in silico digests for buttom-up proteomics)
Below you can find in silico digests of the whole proteome with Trypsin, Chymotrypsin, Trypsin+LysC, LysN, ArgC proteases suitable for different mass spec machines.| Try ESI |
 |
|---|
| ChTry ESI |
|
|---|
| ArgC ESI |
|
|---|
| LysN ESI |
|
|---|
| TryLysC ESI |
|
|---|
| Try MALDI |
|
|---|
| ChTry MALDI |
|
|---|
| ArgC MALDI |
|
|---|
| LysN MALDI |
|
|---|
| TryLysC MALDI |
|
|---|
| Try LTQ |
|
|---|
| ChTry LTQ |
|
|---|
| ArgC LTQ |
|
|---|
| LysN LTQ |
|
|---|
| TryLysC LTQ |
|
|---|
| Try MSlow |
|
|---|
| ChTry MSlow |
|
|---|
| ArgC MSlow |
|
|---|
| LysN MSlow |
|
|---|
| TryLysC MSlow |
|
|---|
| Try MShigh |
|
|---|
| ChTry MShigh |
|
|---|
| ArgC MShigh |
|
|---|
| LysN MShigh |
|
|---|
| TryLysC MShigh |
|
|---|
General Statistics
Number of major isoforms |
Number of additional isoforms |
Number of all proteins |
Number of amino acids |
Min. Seq. Length |
Max. Seq. Length |
Avg. Seq. Length |
Avg. Mol. Weight |
|---|---|---|---|---|---|---|---|
0 |
820680 |
29 |
2168 |
297.1 |
32.14 |
Amino acid frequency
Ala |
Cys |
Asp |
Glu |
Phe |
Gly |
His |
Ile |
Lys |
Leu |
|---|---|---|---|---|---|---|---|---|---|
12.301 ± 0.063 | 1.129 ± 0.016 |
4.935 ± 0.074 | 5.709 ± 0.046 |
2.92 ± 0.032 | 9.055 ± 0.046 |
2.118 ± 0.029 | 3.638 ± 0.033 |
1.895 ± 0.032 | 12.869 ± 0.091 |
Met |
Asn |
Gln |
Pro |
Arg |
Ser |
Thr |
Val |
Trp |
Tyr |
|---|---|---|---|---|---|---|---|---|---|
1.805 ± 0.019 | 2.078 ± 0.029 |
6.456 ± 0.041 | 4.4 ± 0.038 |
7.972 ± 0.057 | 5.602 ± 0.038 |
4.591 ± 0.033 | 7.057 ± 0.048 |
1.709 ± 0.025 | 1.755 ± 0.024 |
Most of the basic statistics you can see at this page can be downloaded from this CSV file
See this proteome in:

Proteome-pI is available under Creative Commons Attribution-NoDerivs license, for more details see here
| Reference: Kozlowski LP. Proteome-pI 2.0: Proteome Isoelectric Point Database Update. Nucleic Acids Res. 2021, doi: 10.1093/nar/gkab944 | Contact: Lukasz P. Kozlowski |