Candidatus Burkholderia pumila
Taxonomy: cellular organisms; Bacteria; Proteobacteria; Betaproteobacteria; Burkholderiales; Burkholderiaceae; Burkholderia
Average proteome isoelectric point is 6.77
Get precalculated fractions of proteins
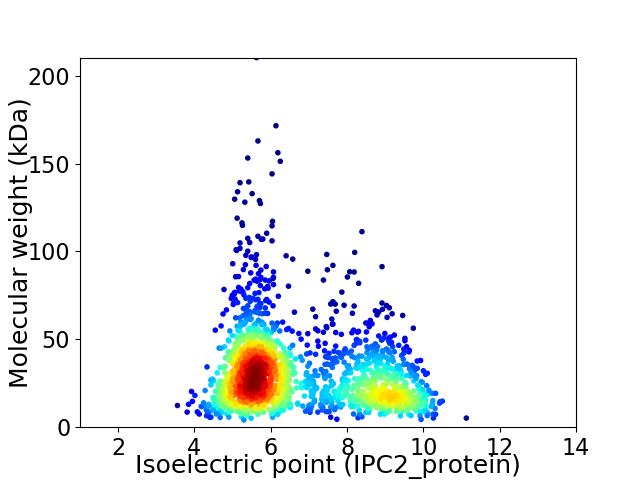
Virtual 2D-PAGE plot for 1736 proteins (isoelectric point calculated using IPC2_protein)
Get csv file with sequences according to given criteria:
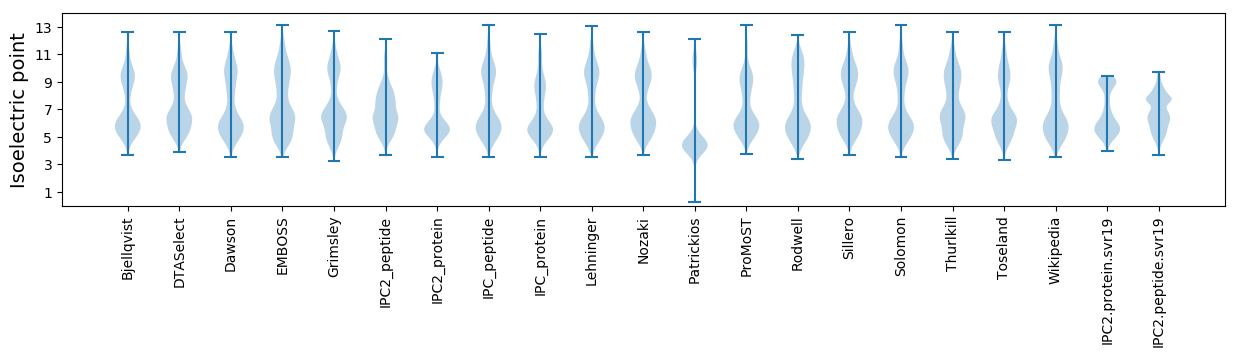
* You can choose from 21 different methods for calculating isoelectric point
Summary statistics related to proteome-wise predictions
Protein with the lowest isoelectric point:
>tr|A0A0J7JK20|A0A0J7JK20_9BURK 4Fe-4S ferredoxin iron-sulfur binding OS=Candidatus Burkholderia pumila OX=1090375 GN=BPMI_00655 PE=4 SV=1
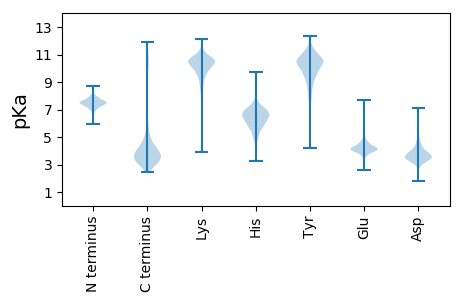
MM1 pKa = 7.26SAVSDD6 pKa = 3.8TLTTEE11 pKa = 3.55MPMPFVFTDD20 pKa = 3.89AAADD24 pKa = 3.92RR25 pKa = 11.84VKK27 pKa = 10.87QLIDD31 pKa = 3.38EE32 pKa = 4.75EE33 pKa = 4.92GNPDD37 pKa = 3.02LKK39 pKa = 11.13LRR41 pKa = 11.84VFVQGGGCSGFQYY54 pKa = 10.98GFTFDD59 pKa = 4.11EE60 pKa = 5.07DD61 pKa = 4.33VNGDD65 pKa = 3.57DD66 pKa = 4.17TVMNKK71 pKa = 10.45AGVQLLVDD79 pKa = 4.04AMSYY83 pKa = 10.37QYY85 pKa = 11.49LVGAEE90 pKa = 4.01IDD92 pKa = 4.0YY93 pKa = 11.29KK94 pKa = 11.43DD95 pKa = 4.74DD96 pKa = 4.18LNGAQFVIKK105 pKa = 10.4NPNATTTCGCGSSFSVV121 pKa = 3.54
MM1 pKa = 7.26SAVSDD6 pKa = 3.8TLTTEE11 pKa = 3.55MPMPFVFTDD20 pKa = 3.89AAADD24 pKa = 3.92RR25 pKa = 11.84VKK27 pKa = 10.87QLIDD31 pKa = 3.38EE32 pKa = 4.75EE33 pKa = 4.92GNPDD37 pKa = 3.02LKK39 pKa = 11.13LRR41 pKa = 11.84VFVQGGGCSGFQYY54 pKa = 10.98GFTFDD59 pKa = 4.11EE60 pKa = 5.07DD61 pKa = 4.33VNGDD65 pKa = 3.57DD66 pKa = 4.17TVMNKK71 pKa = 10.45AGVQLLVDD79 pKa = 4.04AMSYY83 pKa = 10.37QYY85 pKa = 11.49LVGAEE90 pKa = 4.01IDD92 pKa = 4.0YY93 pKa = 11.29KK94 pKa = 11.43DD95 pKa = 4.74DD96 pKa = 4.18LNGAQFVIKK105 pKa = 10.4NPNATTTCGCGSSFSVV121 pKa = 3.54
Molecular weight: 13.03 kDa
Isoelectric point according different methods:
Protein with the highest isoelectric point:
>tr|A0A0J7JQP2|A0A0J7JQP2_9BURK INTEGRAL MEMBRANE PROTEIN (Rhomboid family) OS=Candidatus Burkholderia pumila OX=1090375 GN=BPMI_01474c PE=4 SV=1
MM1 pKa = 7.35KK2 pKa = 9.42RR3 pKa = 11.84TYY5 pKa = 10.26QPSLTRR11 pKa = 11.84RR12 pKa = 11.84KK13 pKa = 8.08RR14 pKa = 11.84THH16 pKa = 5.78GFRR19 pKa = 11.84VRR21 pKa = 11.84MKK23 pKa = 8.74TAGGRR28 pKa = 11.84KK29 pKa = 9.04VINARR34 pKa = 11.84RR35 pKa = 11.84AKK37 pKa = 9.58GRR39 pKa = 11.84KK40 pKa = 8.75RR41 pKa = 11.84LAVV44 pKa = 3.41
MM1 pKa = 7.35KK2 pKa = 9.42RR3 pKa = 11.84TYY5 pKa = 10.26QPSLTRR11 pKa = 11.84RR12 pKa = 11.84KK13 pKa = 8.08RR14 pKa = 11.84THH16 pKa = 5.78GFRR19 pKa = 11.84VRR21 pKa = 11.84MKK23 pKa = 8.74TAGGRR28 pKa = 11.84KK29 pKa = 9.04VINARR34 pKa = 11.84RR35 pKa = 11.84AKK37 pKa = 9.58GRR39 pKa = 11.84KK40 pKa = 8.75RR41 pKa = 11.84LAVV44 pKa = 3.41
Molecular weight: 5.2 kDa
Isoelectric point according different methods:
Peptides (in silico digests for buttom-up proteomics)
Below you can find in silico digests of the whole proteome with Trypsin, Chymotrypsin, Trypsin+LysC, LysN, ArgC proteases suitable for different mass spec machines.| Try ESI |
 |
|---|
| ChTry ESI |
|
|---|
| ArgC ESI |
|
|---|
| LysN ESI |
|
|---|
| TryLysC ESI |
|
|---|
| Try MALDI |
|
|---|
| ChTry MALDI |
|
|---|
| ArgC MALDI |
|
|---|
| LysN MALDI |
|
|---|
| TryLysC MALDI |
|
|---|
| Try LTQ |
|
|---|
| ChTry LTQ |
|
|---|
| ArgC LTQ |
|
|---|
| LysN LTQ |
|
|---|
| TryLysC LTQ |
|
|---|
| Try MSlow |
|
|---|
| ChTry MSlow |
|
|---|
| ArgC MSlow |
|
|---|
| LysN MSlow |
|
|---|
| TryLysC MSlow |
|
|---|
| Try MShigh |
|
|---|
| ChTry MShigh |
|
|---|
| ArgC MShigh |
|
|---|
| LysN MShigh |
|
|---|
| TryLysC MShigh |
|
|---|
General Statistics
Number of major isoforms |
Number of additional isoforms |
Number of all proteins |
Number of amino acids |
Min. Seq. Length |
Max. Seq. Length |
Avg. Seq. Length |
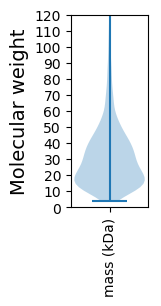
Avg. Mol. Weight |
|---|---|---|---|---|---|---|---|
0 |
515917 |
38 |
1911 |
297.2 |
32.63 |
Amino acid frequency
Ala |
Cys |
Asp |
Glu |
Phe |
Gly |
His |
Ile |
Lys |
Leu |
|---|---|---|---|---|---|---|---|---|---|
11.21 ± 0.08 | 1.035 ± 0.021 |
5.714 ± 0.043 | 5.756 ± 0.057 |
3.781 ± 0.044 | 7.563 ± 0.051 |
2.376 ± 0.027 | 5.306 ± 0.038 |
4.196 ± 0.048 | 9.715 ± 0.055 |
Met |
Asn |
Gln |
Pro |
Arg |
Ser |
Thr |
Val |
Trp |
Tyr |
|---|---|---|---|---|---|---|---|---|---|
2.609 ± 0.026 | 3.222 ± 0.03 |
4.788 ± 0.043 | 3.628 ± 0.037 |
6.784 ± 0.051 | 5.765 ± 0.04 |
5.346 ± 0.034 | 7.528 ± 0.047 |
1.214 ± 0.024 | 2.464 ± 0.029 |
Most of the basic statistics you can see at this page can be downloaded from this CSV file
See this proteome in:

Proteome-pI is available under Creative Commons Attribution-NoDerivs license, for more details see here
| Reference: Kozlowski LP. Proteome-pI 2.0: Proteome Isoelectric Point Database Update. Nucleic Acids Res. 2021, doi: 10.1093/nar/gkab944 | Contact: Lukasz P. Kozlowski |