Candidatus Brocadia fulgida
Taxonomy: cellular organisms; Bacteria; PVC group; Planctomycetes; Candidatus Brocadiae; Candidatus Brocadiales; Candidatus Brocadiaceae; Candidatus Brocadia
Average proteome isoelectric point is 7.05
Get precalculated fractions of proteins

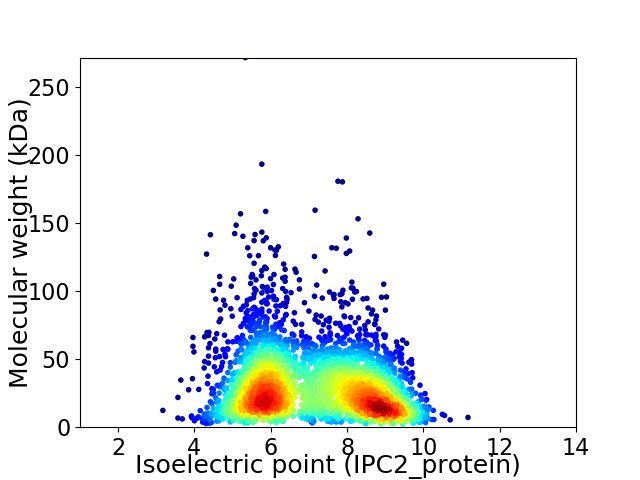
Virtual 2D-PAGE plot for 3391 proteins (isoelectric point calculated using IPC2_protein)
Get csv file with sequences according to given criteria:
* You can choose from 21 different methods for calculating isoelectric point
Summary statistics related to proteome-wise predictions


Protein with the lowest isoelectric point:
>tr|A0A0M2UYY5|A0A0M2UYY5_9BACT Cysteine synthase OS=Candidatus Brocadia fulgida OX=380242 GN=BROFUL_01621 PE=4 SV=1
MM1 pKa = 7.27EE2 pKa = 4.93RR3 pKa = 11.84RR4 pKa = 11.84LRR6 pKa = 11.84GHH8 pKa = 6.18EE9 pKa = 4.0PSWWDD14 pKa = 3.53DD15 pKa = 3.56MGLAWYY21 pKa = 10.58NEE23 pKa = 4.28IANTAHH29 pKa = 6.41SGAYY33 pKa = 9.37AQDD36 pKa = 3.38GQTIDD41 pKa = 3.77GNVVDD46 pKa = 5.93SLFTDD51 pKa = 3.65TGLVNWGNDD60 pKa = 3.25HH61 pKa = 7.0NNIDD65 pKa = 3.75VADD68 pKa = 3.91AALIFMHH75 pKa = 6.92GSEE78 pKa = 5.65SNDD81 pKa = 2.49RR82 pKa = 11.84WQGSVRR88 pKa = 11.84VDD90 pKa = 3.06EE91 pKa = 5.64AGAGDD96 pKa = 4.12CQTWQGDD103 pKa = 3.58MRR105 pKa = 11.84FGNTNLKK112 pKa = 9.82FLHH115 pKa = 6.54LSSCNSMDD123 pKa = 3.94DD124 pKa = 3.93NQWADD129 pKa = 3.47RR130 pKa = 11.84WWEE133 pKa = 4.2SFSGLHH139 pKa = 5.48QVDD142 pKa = 4.42GFHH145 pKa = 6.58GFMWIGSDD153 pKa = 4.25LVSDD157 pKa = 4.39YY158 pKa = 11.71EE159 pKa = 4.91DD160 pKa = 3.69FASDD164 pKa = 4.14AFTATIADD172 pKa = 3.26AWLDD176 pKa = 3.7NMYY179 pKa = 10.35HH180 pKa = 6.77ADD182 pKa = 3.57ISGTDD187 pKa = 3.61DD188 pKa = 3.41QCPVAYY194 pKa = 9.87AVGVNSDD201 pKa = 3.89DD202 pKa = 2.93TWNRR206 pKa = 11.84IGAEE210 pKa = 3.93RR211 pKa = 11.84YY212 pKa = 10.41NNVLSNPTSVGYY224 pKa = 9.64WGTIYY229 pKa = 10.81FEE231 pKa = 4.56NCDD234 pKa = 3.9PANEE238 pKa = 4.14DD239 pKa = 4.05TIGTGIDD246 pKa = 3.1
MM1 pKa = 7.27EE2 pKa = 4.93RR3 pKa = 11.84RR4 pKa = 11.84LRR6 pKa = 11.84GHH8 pKa = 6.18EE9 pKa = 4.0PSWWDD14 pKa = 3.53DD15 pKa = 3.56MGLAWYY21 pKa = 10.58NEE23 pKa = 4.28IANTAHH29 pKa = 6.41SGAYY33 pKa = 9.37AQDD36 pKa = 3.38GQTIDD41 pKa = 3.77GNVVDD46 pKa = 5.93SLFTDD51 pKa = 3.65TGLVNWGNDD60 pKa = 3.25HH61 pKa = 7.0NNIDD65 pKa = 3.75VADD68 pKa = 3.91AALIFMHH75 pKa = 6.92GSEE78 pKa = 5.65SNDD81 pKa = 2.49RR82 pKa = 11.84WQGSVRR88 pKa = 11.84VDD90 pKa = 3.06EE91 pKa = 5.64AGAGDD96 pKa = 4.12CQTWQGDD103 pKa = 3.58MRR105 pKa = 11.84FGNTNLKK112 pKa = 9.82FLHH115 pKa = 6.54LSSCNSMDD123 pKa = 3.94DD124 pKa = 3.93NQWADD129 pKa = 3.47RR130 pKa = 11.84WWEE133 pKa = 4.2SFSGLHH139 pKa = 5.48QVDD142 pKa = 4.42GFHH145 pKa = 6.58GFMWIGSDD153 pKa = 4.25LVSDD157 pKa = 4.39YY158 pKa = 11.71EE159 pKa = 4.91DD160 pKa = 3.69FASDD164 pKa = 4.14AFTATIADD172 pKa = 3.26AWLDD176 pKa = 3.7NMYY179 pKa = 10.35HH180 pKa = 6.77ADD182 pKa = 3.57ISGTDD187 pKa = 3.61DD188 pKa = 3.41QCPVAYY194 pKa = 9.87AVGVNSDD201 pKa = 3.89DD202 pKa = 2.93TWNRR206 pKa = 11.84IGAEE210 pKa = 3.93RR211 pKa = 11.84YY212 pKa = 10.41NNVLSNPTSVGYY224 pKa = 9.64WGTIYY229 pKa = 10.81FEE231 pKa = 4.56NCDD234 pKa = 3.9PANEE238 pKa = 4.14DD239 pKa = 4.05TIGTGIDD246 pKa = 3.1
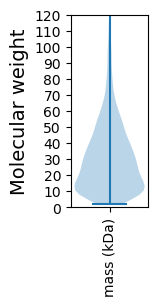
Molecular weight: 27.47 kDa
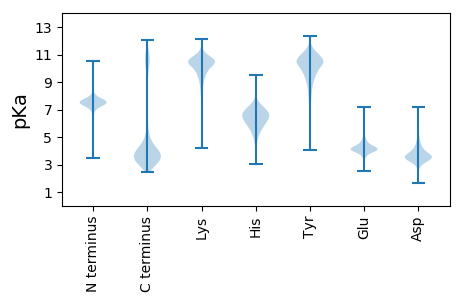
Isoelectric point according different methods:
Protein with the highest isoelectric point:
>tr|A0A0M2UV12|A0A0M2UV12_9BACT FAD:protein FMN transferase OS=Candidatus Brocadia fulgida OX=380242 GN=BROFUL_02986 PE=4 SV=1
MM1 pKa = 7.84PKK3 pKa = 10.57LKK5 pKa = 8.68THH7 pKa = 6.7KK8 pKa = 10.27GLKK11 pKa = 9.64KK12 pKa = 10.16RR13 pKa = 11.84IKK15 pKa = 9.83ISAKK19 pKa = 10.35GKK21 pKa = 8.73VKK23 pKa = 10.4RR24 pKa = 11.84PKK26 pKa = 10.06AGKK29 pKa = 8.71GHH31 pKa = 6.81LMSGKK36 pKa = 8.99SGRR39 pKa = 11.84RR40 pKa = 11.84RR41 pKa = 11.84AHH43 pKa = 5.61LRR45 pKa = 11.84KK46 pKa = 8.78KK47 pKa = 8.97TGVSSAFNKK56 pKa = 9.56TMTRR60 pKa = 11.84ALRR63 pKa = 11.84GSS65 pKa = 3.44
MM1 pKa = 7.84PKK3 pKa = 10.57LKK5 pKa = 8.68THH7 pKa = 6.7KK8 pKa = 10.27GLKK11 pKa = 9.64KK12 pKa = 10.16RR13 pKa = 11.84IKK15 pKa = 9.83ISAKK19 pKa = 10.35GKK21 pKa = 8.73VKK23 pKa = 10.4RR24 pKa = 11.84PKK26 pKa = 10.06AGKK29 pKa = 8.71GHH31 pKa = 6.81LMSGKK36 pKa = 8.99SGRR39 pKa = 11.84RR40 pKa = 11.84RR41 pKa = 11.84AHH43 pKa = 5.61LRR45 pKa = 11.84KK46 pKa = 8.78KK47 pKa = 8.97TGVSSAFNKK56 pKa = 9.56TMTRR60 pKa = 11.84ALRR63 pKa = 11.84GSS65 pKa = 3.44
Molecular weight: 7.18 kDa
Isoelectric point according different methods:
Peptides (in silico digests for buttom-up proteomics)
Below you can find in silico digests of the whole proteome with Trypsin, Chymotrypsin, Trypsin+LysC, LysN, ArgC proteases suitable for different mass spec machines.| Try ESI |
 |
|---|
| ChTry ESI |
 |
|---|
| ArgC ESI |
 |
|---|
| LysN ESI |
 |
|---|
| TryLysC ESI |
 |
|---|
| Try MALDI |
 |
|---|
| ChTry MALDI |
 |
|---|
| ArgC MALDI |
 |
|---|
| LysN MALDI |
 |
|---|
| TryLysC MALDI |
 |
|---|
| Try LTQ |
 |
|---|
| ChTry LTQ |
 |
|---|
| ArgC LTQ |
 |
|---|
| LysN LTQ |
 |
|---|
| TryLysC LTQ |
 |
|---|
| Try MSlow |
 |
|---|
| ChTry MSlow |
 |
|---|
| ArgC MSlow |
 |
|---|
| LysN MSlow |
 |
|---|
| TryLysC MSlow |
 |
|---|
| Try MShigh |
 |
|---|
| ChTry MShigh |
 |
|---|
| ArgC MShigh |
 |
|---|
| LysN MShigh |
 |
|---|
| TryLysC MShigh |
 |
|---|
General Statistics
Number of major isoforms |
Number of additional isoforms |
Number of all proteins |
Number of amino acids |
Min. Seq. Length |
Max. Seq. Length |
Avg. Seq. Length |
Avg. Mol. Weight |
|---|---|---|---|---|---|---|---|
0 |
980976 |
20 |
2423 |
289.3 |
32.51 |
Amino acid frequency
Ala |
Cys |
Asp |
Glu |
Phe |
Gly |
His |
Ile |
Lys |
Leu |
|---|---|---|---|---|---|---|---|---|---|
7.231 ± 0.04 | 1.381 ± 0.016 |
5.259 ± 0.033 | 6.675 ± 0.047 |
4.466 ± 0.034 | 6.99 ± 0.043 |
2.275 ± 0.022 | 7.631 ± 0.037 |
6.962 ± 0.045 | 9.336 ± 0.041 |
Met |
Asn |
Gln |
Pro |
Arg |
Ser |
Thr |
Val |
Trp |
Tyr |
|---|---|---|---|---|---|---|---|---|---|
2.492 ± 0.022 | 4.131 ± 0.03 |
4.041 ± 0.026 | 3.228 ± 0.024 |
5.353 ± 0.036 | 5.94 ± 0.036 |
5.39 ± 0.04 | 6.738 ± 0.033 |
1.085 ± 0.018 | 3.399 ± 0.025 |
Most of the basic statistics you can see at this page can be downloaded from this CSV file
Proteome-pI is available under Creative Commons Attribution-NoDerivs license, for more details see here
| Reference: Kozlowski LP. Proteome-pI 2.0: Proteome Isoelectric Point Database Update. Nucleic Acids Res. 2021, doi: 10.1093/nar/gkab944 | Contact: Lukasz P. Kozlowski |
