Sunxiuqinia dokdonensis
Taxonomy: cellular organisms; Bacteria; FCB group; Bacteroidetes/Chlorobi group; Bacteroidetes; Bacteroidia; Marinilabiliales; Prolixibacteraceae; Sunxiuqinia
Average proteome isoelectric point is 6.5
Get precalculated fractions of proteins

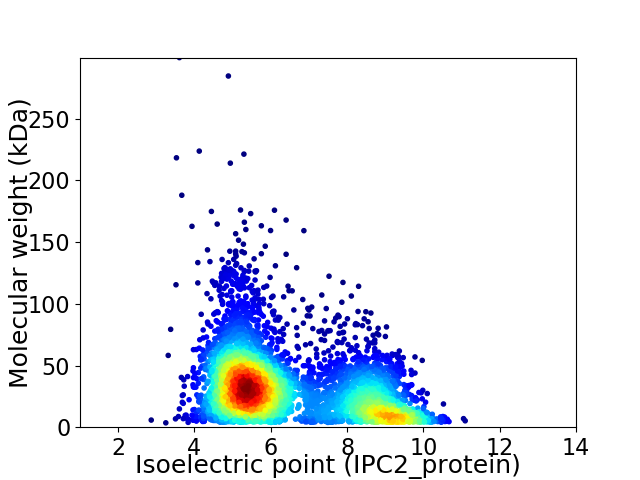
Virtual 2D-PAGE plot for 4693 proteins (isoelectric point calculated using IPC2_protein)
Get csv file with sequences according to given criteria:
* You can choose from 21 different methods for calculating isoelectric point
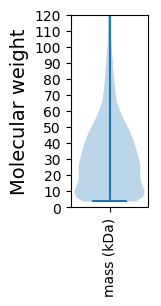
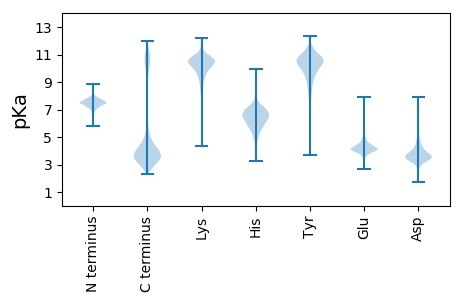
Summary statistics related to proteome-wise predictions


Protein with the lowest isoelectric point:
>tr|A0A0L8VCW9|A0A0L8VCW9_9BACT Dihydroorotate dehydrogenase OS=Sunxiuqinia dokdonensis OX=1409788 GN=pyrD PE=3 SV=1
MM1 pKa = 7.42KK2 pKa = 10.16KK3 pKa = 9.98IIPIAVSVLMIGLVACEE20 pKa = 4.1PEE22 pKa = 4.44EE23 pKa = 4.45VAFDD27 pKa = 3.65PAADD31 pKa = 3.46VFVITKK37 pKa = 8.49TVATEE42 pKa = 4.06NEE44 pKa = 3.66VDD46 pKa = 3.7TVYY49 pKa = 11.42GLALHH54 pKa = 7.0AFANKK59 pKa = 9.21PMQSVKK65 pKa = 8.98VTSVDD70 pKa = 2.85NTTYY74 pKa = 11.05DD75 pKa = 3.36LEE77 pKa = 4.67SYY79 pKa = 10.19EE80 pKa = 4.29GYY82 pKa = 9.9PYY84 pKa = 11.09DD85 pKa = 5.78FYY87 pKa = 11.75AQTEE91 pKa = 4.14DD92 pKa = 4.16DD93 pKa = 4.67DD94 pKa = 5.72FSAEE98 pKa = 4.09MPEE101 pKa = 3.9SGAYY105 pKa = 9.65SFNIVAQSGEE115 pKa = 4.2TSTLSDD121 pKa = 3.78NLSDD125 pKa = 4.27DD126 pKa = 4.03VIYY129 pKa = 8.77PTDD132 pKa = 3.71TIKK135 pKa = 11.16YY136 pKa = 10.15AFDD139 pKa = 4.1DD140 pKa = 4.32AQNKK144 pKa = 7.78MKK146 pKa = 9.68LTWTEE151 pKa = 3.95IEE153 pKa = 4.2DD154 pKa = 3.59ADD156 pKa = 3.98YY157 pKa = 11.3LIVKK161 pKa = 8.7MFEE164 pKa = 3.8QDD166 pKa = 3.36DD167 pKa = 4.12DD168 pKa = 4.13QVFQSSSLLGDD179 pKa = 3.42KK180 pKa = 10.81EE181 pKa = 4.58EE182 pKa = 4.28YY183 pKa = 9.72TISASGSGWASDD195 pKa = 3.58FQPADD200 pKa = 3.02GATYY204 pKa = 10.07IIQLDD209 pKa = 3.64AFKK212 pKa = 11.24YY213 pKa = 9.95EE214 pKa = 4.2SGQNGVNLQAKK225 pKa = 9.64SISLQEE231 pKa = 4.12IVWGEE236 pKa = 3.86EE237 pKa = 3.67
MM1 pKa = 7.42KK2 pKa = 10.16KK3 pKa = 9.98IIPIAVSVLMIGLVACEE20 pKa = 4.1PEE22 pKa = 4.44EE23 pKa = 4.45VAFDD27 pKa = 3.65PAADD31 pKa = 3.46VFVITKK37 pKa = 8.49TVATEE42 pKa = 4.06NEE44 pKa = 3.66VDD46 pKa = 3.7TVYY49 pKa = 11.42GLALHH54 pKa = 7.0AFANKK59 pKa = 9.21PMQSVKK65 pKa = 8.98VTSVDD70 pKa = 2.85NTTYY74 pKa = 11.05DD75 pKa = 3.36LEE77 pKa = 4.67SYY79 pKa = 10.19EE80 pKa = 4.29GYY82 pKa = 9.9PYY84 pKa = 11.09DD85 pKa = 5.78FYY87 pKa = 11.75AQTEE91 pKa = 4.14DD92 pKa = 4.16DD93 pKa = 4.67DD94 pKa = 5.72FSAEE98 pKa = 4.09MPEE101 pKa = 3.9SGAYY105 pKa = 9.65SFNIVAQSGEE115 pKa = 4.2TSTLSDD121 pKa = 3.78NLSDD125 pKa = 4.27DD126 pKa = 4.03VIYY129 pKa = 8.77PTDD132 pKa = 3.71TIKK135 pKa = 11.16YY136 pKa = 10.15AFDD139 pKa = 4.1DD140 pKa = 4.32AQNKK144 pKa = 7.78MKK146 pKa = 9.68LTWTEE151 pKa = 3.95IEE153 pKa = 4.2DD154 pKa = 3.59ADD156 pKa = 3.98YY157 pKa = 11.3LIVKK161 pKa = 8.7MFEE164 pKa = 3.8QDD166 pKa = 3.36DD167 pKa = 4.12DD168 pKa = 4.13QVFQSSSLLGDD179 pKa = 3.42KK180 pKa = 10.81EE181 pKa = 4.58EE182 pKa = 4.28YY183 pKa = 9.72TISASGSGWASDD195 pKa = 3.58FQPADD200 pKa = 3.02GATYY204 pKa = 10.07IIQLDD209 pKa = 3.64AFKK212 pKa = 11.24YY213 pKa = 9.95EE214 pKa = 4.2SGQNGVNLQAKK225 pKa = 9.64SISLQEE231 pKa = 4.12IVWGEE236 pKa = 3.86EE237 pKa = 3.67
Molecular weight: 26.21 kDa
Isoelectric point according different methods:
Protein with the highest isoelectric point:
>tr|A0A0L8V9D6|A0A0L8V9D6_9BACT Dehydrogenase OS=Sunxiuqinia dokdonensis OX=1409788 GN=NC99_21860 PE=4 SV=1
MM1 pKa = 7.53SLLLLTSNTQPRR13 pKa = 11.84FRR15 pKa = 11.84GPINVGNRR23 pKa = 11.84SHH25 pKa = 7.1PRR27 pKa = 11.84RR28 pKa = 11.84PKK30 pKa = 9.95FSFRR34 pKa = 11.84TLLRR38 pKa = 11.84KK39 pKa = 9.25AVHH42 pKa = 6.56RR43 pKa = 11.84KK44 pKa = 8.9
MM1 pKa = 7.53SLLLLTSNTQPRR13 pKa = 11.84FRR15 pKa = 11.84GPINVGNRR23 pKa = 11.84SHH25 pKa = 7.1PRR27 pKa = 11.84RR28 pKa = 11.84PKK30 pKa = 9.95FSFRR34 pKa = 11.84TLLRR38 pKa = 11.84KK39 pKa = 9.25AVHH42 pKa = 6.56RR43 pKa = 11.84KK44 pKa = 8.9
Molecular weight: 5.19 kDa
Isoelectric point according different methods:
Peptides (in silico digests for buttom-up proteomics)
Below you can find in silico digests of the whole proteome with Trypsin, Chymotrypsin, Trypsin+LysC, LysN, ArgC proteases suitable for different mass spec machines.| Try ESI |
 |
|---|
| ChTry ESI |
 |
|---|
| ArgC ESI |
 |
|---|
| LysN ESI |
 |
|---|
| TryLysC ESI |
 |
|---|
| Try MALDI |
 |
|---|
| ChTry MALDI |
 |
|---|
| ArgC MALDI |
 |
|---|
| LysN MALDI |
 |
|---|
| TryLysC MALDI |
 |
|---|
| Try LTQ |
 |
|---|
| ChTry LTQ |
 |
|---|
| ArgC LTQ |
 |
|---|
| LysN LTQ |
 |
|---|
| TryLysC LTQ |
 |
|---|
| Try MSlow |
 |
|---|
| ChTry MSlow |
 |
|---|
| ArgC MSlow |
 |
|---|
| LysN MSlow |
 |
|---|
| TryLysC MSlow |
 |
|---|
| Try MShigh |
 |
|---|
| ChTry MShigh |
 |
|---|
| ArgC MShigh |
 |
|---|
| LysN MShigh |
 |
|---|
| TryLysC MShigh |
 |
|---|
General Statistics
Number of major isoforms |
Number of additional isoforms |
Number of all proteins |
Number of amino acids |
Min. Seq. Length |
Max. Seq. Length |
Avg. Seq. Length |
Avg. Mol. Weight |
|---|---|---|---|---|---|---|---|
0 |
1442061 |
37 |
2867 |
307.3 |
34.68 |
Amino acid frequency
Ala |
Cys |
Asp |
Glu |
Phe |
Gly |
His |
Ile |
Lys |
Leu |
|---|---|---|---|---|---|---|---|---|---|
6.985 ± 0.037 | 0.816 ± 0.015 |
5.604 ± 0.028 | 6.827 ± 0.033 |
5.158 ± 0.027 | 6.793 ± 0.036 |
1.973 ± 0.014 | 6.896 ± 0.036 |
6.534 ± 0.037 | 9.642 ± 0.041 |
Met |
Asn |
Gln |
Pro |
Arg |
Ser |
Thr |
Val |
Trp |
Tyr |
|---|---|---|---|---|---|---|---|---|---|
2.475 ± 0.017 | 5.089 ± 0.028 |
3.809 ± 0.021 | 4.004 ± 0.026 |
4.363 ± 0.025 | 6.255 ± 0.028 |
5.163 ± 0.037 | 6.456 ± 0.023 |
1.285 ± 0.015 | 3.874 ± 0.023 |
Most of the basic statistics you can see at this page can be downloaded from this CSV file
Proteome-pI is available under Creative Commons Attribution-NoDerivs license, for more details see here
| Reference: Kozlowski LP. Proteome-pI 2.0: Proteome Isoelectric Point Database Update. Nucleic Acids Res. 2021, doi: 10.1093/nar/gkab944 | Contact: Lukasz P. Kozlowski |
