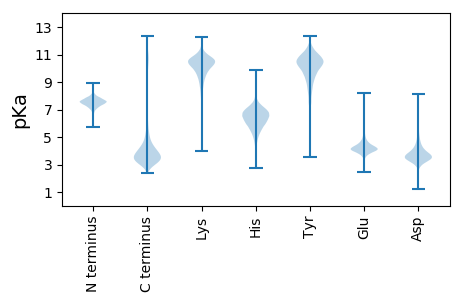
Penicillium brasilianum
Taxonomy: cellular organisms; Eukaryota; Opisthokonta; Fungi; Dikarya; Ascomycota; saccharomyceta; Pezizomycotina; leotiomyceta; Eurotiomycetes; Eurotiomycetidae
Average proteome isoelectric point is 6.37
Get precalculated fractions of proteins

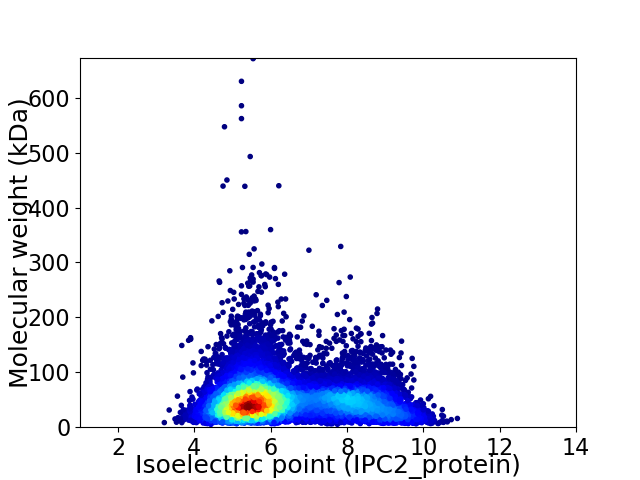
Virtual 2D-PAGE plot for 11935 proteins (isoelectric point calculated using IPC2_protein)
Get csv file with sequences according to given criteria:
* You can choose from 21 different methods for calculating isoelectric point
Summary statistics related to proteome-wise predictions


Protein with the lowest isoelectric point:
>tr|A0A0F7VJ14|A0A0F7VJ14_PENBI Aspartate aminotransferase OS=Penicillium brasilianum OX=104259 GN=PMG11_04320 PE=3 SV=1
MM1 pKa = 7.59GFLKK5 pKa = 10.74KK6 pKa = 9.62LTLFAAFASLAAALPYY22 pKa = 10.57GEE24 pKa = 5.19RR25 pKa = 11.84PPTLVNLAAVAPTTTTAAAASTSSTSVTTSATSISTSISTSTSTSTSTSTSTSTSTSNGIKK86 pKa = 9.83IVNNLDD92 pKa = 3.1QTVYY96 pKa = 10.51LWSTSDD102 pKa = 3.32TSSDD106 pKa = 3.48MQTLTSGSTYY116 pKa = 10.16TEE118 pKa = 3.78TWRR121 pKa = 11.84TNSDD125 pKa = 2.95GGGISIKK132 pKa = 9.88MATSTSEE139 pKa = 4.03SSVLQFEE146 pKa = 4.63YY147 pKa = 10.45TKK149 pKa = 10.85SDD151 pKa = 3.29EE152 pKa = 4.34TLWWDD157 pKa = 4.12LSSINLDD164 pKa = 3.34SDD166 pKa = 4.13SEE168 pKa = 4.72FITSGFAVTTDD179 pKa = 3.93DD180 pKa = 4.78SSCTTASCAAGDD192 pKa = 3.94TDD194 pKa = 5.88CADD197 pKa = 3.88SYY199 pKa = 11.7QNPDD203 pKa = 3.45DD204 pKa = 4.23VDD206 pKa = 3.66TRR208 pKa = 11.84SCSASAAFTMTIGG221 pKa = 3.51
MM1 pKa = 7.59GFLKK5 pKa = 10.74KK6 pKa = 9.62LTLFAAFASLAAALPYY22 pKa = 10.57GEE24 pKa = 5.19RR25 pKa = 11.84PPTLVNLAAVAPTTTTAAAASTSSTSVTTSATSISTSISTSTSTSTSTSTSTSTSTSNGIKK86 pKa = 9.83IVNNLDD92 pKa = 3.1QTVYY96 pKa = 10.51LWSTSDD102 pKa = 3.32TSSDD106 pKa = 3.48MQTLTSGSTYY116 pKa = 10.16TEE118 pKa = 3.78TWRR121 pKa = 11.84TNSDD125 pKa = 2.95GGGISIKK132 pKa = 9.88MATSTSEE139 pKa = 4.03SSVLQFEE146 pKa = 4.63YY147 pKa = 10.45TKK149 pKa = 10.85SDD151 pKa = 3.29EE152 pKa = 4.34TLWWDD157 pKa = 4.12LSSINLDD164 pKa = 3.34SDD166 pKa = 4.13SEE168 pKa = 4.72FITSGFAVTTDD179 pKa = 3.93DD180 pKa = 4.78SSCTTASCAAGDD192 pKa = 3.94TDD194 pKa = 5.88CADD197 pKa = 3.88SYY199 pKa = 11.7QNPDD203 pKa = 3.45DD204 pKa = 4.23VDD206 pKa = 3.66TRR208 pKa = 11.84SCSASAAFTMTIGG221 pKa = 3.51
Molecular weight: 22.85 kDa
Isoelectric point according different methods:
Protein with the highest isoelectric point:
>tr|A0A0F7TRT7|A0A0F7TRT7_PENBI Acyl_transf_3 domain-containing protein OS=Penicillium brasilianum OX=104259 GN=PMG11_06420 PE=4 SV=1
MM1 pKa = 7.56LCLRR5 pKa = 11.84CRR7 pKa = 11.84ALPSFQATVSAMRR20 pKa = 11.84TPMTRR25 pKa = 11.84ITQFTPQTSLTSTARR40 pKa = 11.84LSSRR44 pKa = 11.84PFSTTLLSTPTRR56 pKa = 11.84LQPSQTLSVSPRR68 pKa = 11.84TPSTSALSTPSISSLLPPQSRR89 pKa = 11.84SFSATASLGVKK100 pKa = 9.98RR101 pKa = 11.84NTFRR105 pKa = 11.84PSRR108 pKa = 11.84RR109 pKa = 11.84VQKK112 pKa = 10.38RR113 pKa = 11.84RR114 pKa = 11.84SGFLARR120 pKa = 11.84NTDD123 pKa = 2.92RR124 pKa = 11.84KK125 pKa = 10.79GRR127 pKa = 11.84LTLIRR132 pKa = 11.84RR133 pKa = 11.84RR134 pKa = 11.84LKK136 pKa = 10.46GRR138 pKa = 11.84KK139 pKa = 8.86AMSWW143 pKa = 3.05
MM1 pKa = 7.56LCLRR5 pKa = 11.84CRR7 pKa = 11.84ALPSFQATVSAMRR20 pKa = 11.84TPMTRR25 pKa = 11.84ITQFTPQTSLTSTARR40 pKa = 11.84LSSRR44 pKa = 11.84PFSTTLLSTPTRR56 pKa = 11.84LQPSQTLSVSPRR68 pKa = 11.84TPSTSALSTPSISSLLPPQSRR89 pKa = 11.84SFSATASLGVKK100 pKa = 9.98RR101 pKa = 11.84NTFRR105 pKa = 11.84PSRR108 pKa = 11.84RR109 pKa = 11.84VQKK112 pKa = 10.38RR113 pKa = 11.84RR114 pKa = 11.84SGFLARR120 pKa = 11.84NTDD123 pKa = 2.92RR124 pKa = 11.84KK125 pKa = 10.79GRR127 pKa = 11.84LTLIRR132 pKa = 11.84RR133 pKa = 11.84RR134 pKa = 11.84LKK136 pKa = 10.46GRR138 pKa = 11.84KK139 pKa = 8.86AMSWW143 pKa = 3.05
Molecular weight: 15.94 kDa
Isoelectric point according different methods:
Peptides (in silico digests for buttom-up proteomics)
Below you can find in silico digests of the whole proteome with Trypsin, Chymotrypsin, Trypsin+LysC, LysN, ArgC proteases suitable for different mass spec machines.| Try ESI |
 |
|---|
| ChTry ESI |
 |
|---|
| ArgC ESI |
 |
|---|
| LysN ESI |
 |
|---|
| TryLysC ESI |
 |
|---|
| Try MALDI |
 |
|---|
| ChTry MALDI |
 |
|---|
| ArgC MALDI |
 |
|---|
| LysN MALDI |
 |
|---|
| TryLysC MALDI |
 |
|---|
| Try LTQ |
 |
|---|
| ChTry LTQ |
 |
|---|
| ArgC LTQ |
 |
|---|
| LysN LTQ |
 |
|---|
| TryLysC LTQ |
 |
|---|
| Try MSlow |
 |
|---|
| ChTry MSlow |
 |
|---|
| ArgC MSlow |
 |
|---|
| LysN MSlow |
 |
|---|
| TryLysC MSlow |
 |
|---|
| Try MShigh |
 |
|---|
| ChTry MShigh |
 |
|---|
| ArgC MShigh |
 |
|---|
| LysN MShigh |
 |
|---|
| TryLysC MShigh |
 |
|---|
General Statistics
Number of major isoforms |
Number of additional isoforms |
Number of all proteins |
Number of amino acids |
Min. Seq. Length |
Max. Seq. Length |
Avg. Seq. Length |
Avg. Mol. Weight |
|---|---|---|---|---|---|---|---|
5855176 |
47 |
6077 |
490.6 |
54.3 |
Amino acid frequency
Ala |
Cys |
Asp |
Glu |
Phe |
Gly |
His |
Ile |
Lys |
Leu |
|---|---|---|---|---|---|---|---|---|---|
8.575 ± 0.019 | 1.245 ± 0.009 |
5.618 ± 0.015 | 6.11 ± 0.022 |
3.8 ± 0.013 | 6.776 ± 0.022 |
2.425 ± 0.01 | 5.048 ± 0.016 |
4.543 ± 0.018 | 9.052 ± 0.023 |
Met |
Asn |
Gln |
Pro |
Arg |
Ser |
Thr |
Val |
Trp |
Tyr |
|---|---|---|---|---|---|---|---|---|---|
2.196 ± 0.008 | 3.645 ± 0.011 |
6.02 ± 0.024 | 4.087 ± 0.016 |
6.068 ± 0.02 | 8.44 ± 0.024 |
5.965 ± 0.016 | 6.115 ± 0.014 |
1.49 ± 0.009 | 2.784 ± 0.011 |
Most of the basic statistics you can see at this page can be downloaded from this CSV file
Proteome-pI is available under Creative Commons Attribution-NoDerivs license, for more details see here
| Reference: Kozlowski LP. Proteome-pI 2.0: Proteome Isoelectric Point Database Update. Nucleic Acids Res. 2021, doi: 10.1093/nar/gkab944 | Contact: Lukasz P. Kozlowski |
