Sutterella sp. AM11-39
Taxonomy: cellular organisms; Bacteria; Proteobacteria; Betaproteobacteria; Burkholderiales; Sutterellaceae; Sutterella; unclassified Sutterella
Average proteome isoelectric point is 6.61
Get precalculated fractions of proteins
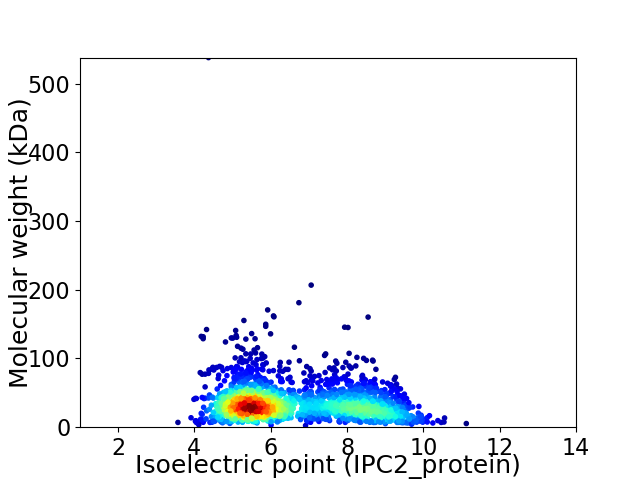
Virtual 2D-PAGE plot for 1912 proteins (isoelectric point calculated using IPC2_protein)
Get csv file with sequences according to given criteria:
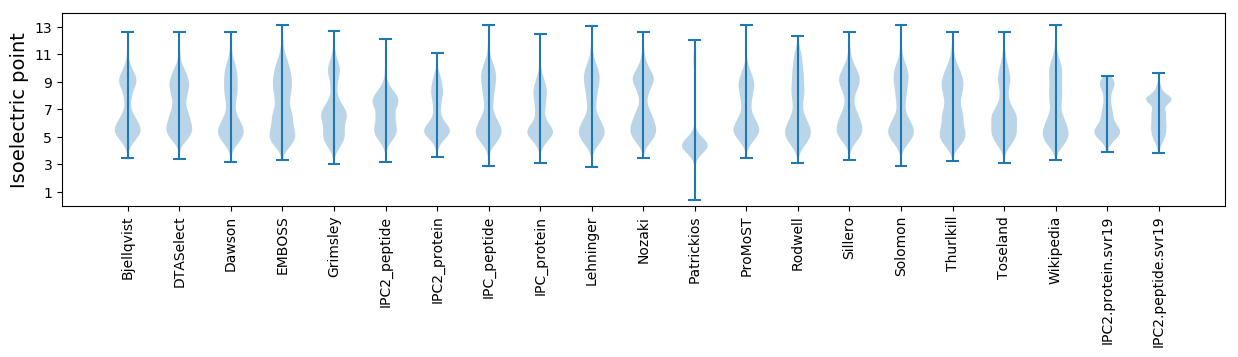
* You can choose from 21 different methods for calculating isoelectric point
Summary statistics related to proteome-wise predictions
Protein with the lowest isoelectric point:
>tr|A0A415CFK7|A0A415CFK7_9BURK TetR/AcrR family transcriptional regulator OS=Sutterella sp. AM11-39 OX=2292075 GN=DW133_05565 PE=4 SV=1
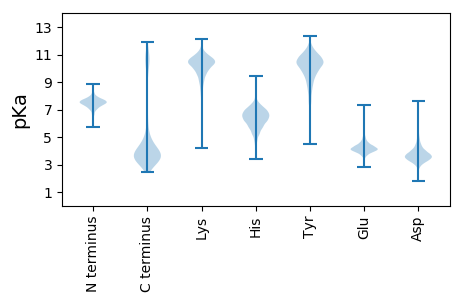
MM1 pKa = 7.79IYY3 pKa = 10.13FYY5 pKa = 10.52WLTGLGMAILLSVVVSTTLDD25 pKa = 3.25NRR27 pKa = 11.84EE28 pKa = 4.21AADD31 pKa = 3.58EE32 pKa = 4.11
MM1 pKa = 7.79IYY3 pKa = 10.13FYY5 pKa = 10.52WLTGLGMAILLSVVVSTTLDD25 pKa = 3.25NRR27 pKa = 11.84EE28 pKa = 4.21AADD31 pKa = 3.58EE32 pKa = 4.11
Molecular weight: 3.59 kDa
Isoelectric point according different methods:
Protein with the highest isoelectric point:
>tr|A0A415CFR0|A0A415CFR0_9BURK 16S rRNA m5C967 methyltransferase OS=Sutterella sp. AM11-39 OX=2292075 GN=DW133_05960 PE=3 SV=1
MM1 pKa = 6.85ATKK4 pKa = 9.51RR5 pKa = 11.84TYY7 pKa = 10.41QPSKK11 pKa = 7.96TKK13 pKa = 10.33RR14 pKa = 11.84ARR16 pKa = 11.84THH18 pKa = 5.82GFLVRR23 pKa = 11.84SRR25 pKa = 11.84TKK27 pKa = 10.32GGRR30 pKa = 11.84AVLARR35 pKa = 11.84RR36 pKa = 11.84RR37 pKa = 11.84RR38 pKa = 11.84KK39 pKa = 9.37GRR41 pKa = 11.84HH42 pKa = 3.98VLALL46 pKa = 3.77
MM1 pKa = 6.85ATKK4 pKa = 9.51RR5 pKa = 11.84TYY7 pKa = 10.41QPSKK11 pKa = 7.96TKK13 pKa = 10.33RR14 pKa = 11.84ARR16 pKa = 11.84THH18 pKa = 5.82GFLVRR23 pKa = 11.84SRR25 pKa = 11.84TKK27 pKa = 10.32GGRR30 pKa = 11.84AVLARR35 pKa = 11.84RR36 pKa = 11.84RR37 pKa = 11.84RR38 pKa = 11.84KK39 pKa = 9.37GRR41 pKa = 11.84HH42 pKa = 3.98VLALL46 pKa = 3.77
Molecular weight: 5.33 kDa
Isoelectric point according different methods:
Peptides (in silico digests for buttom-up proteomics)
Below you can find in silico digests of the whole proteome with Trypsin, Chymotrypsin, Trypsin+LysC, LysN, ArgC proteases suitable for different mass spec machines.| Try ESI |
 |
|---|
| ChTry ESI |
|
|---|
| ArgC ESI |
|
|---|
| LysN ESI |
|
|---|
| TryLysC ESI |
|
|---|
| Try MALDI |
|
|---|
| ChTry MALDI |
|
|---|
| ArgC MALDI |
|
|---|
| LysN MALDI |
|
|---|
| TryLysC MALDI |
|
|---|
| Try LTQ |
|
|---|
| ChTry LTQ |
|
|---|
| ArgC LTQ |
|
|---|
| LysN LTQ |
|
|---|
| TryLysC LTQ |
|
|---|
| Try MSlow |
|
|---|
| ChTry MSlow |
|
|---|
| ArgC MSlow |
|
|---|
| LysN MSlow |
|
|---|
| TryLysC MSlow |
|
|---|
| Try MShigh |
|
|---|
| ChTry MShigh |
|
|---|
| ArgC MShigh |
|
|---|
| LysN MShigh |
|
|---|
| TryLysC MShigh |
|
|---|
General Statistics
Number of major isoforms |
Number of additional isoforms |
Number of all proteins |
Number of amino acids |
Min. Seq. Length |
Max. Seq. Length |
Avg. Seq. Length |
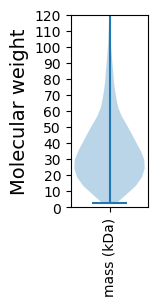
Avg. Mol. Weight |
|---|---|---|---|---|---|---|---|
0 |
646839 |
21 |
5244 |
338.3 |
37.14 |
Amino acid frequency
Ala |
Cys |
Asp |
Glu |
Phe |
Gly |
His |
Ile |
Lys |
Leu |
|---|---|---|---|---|---|---|---|---|---|
10.629 ± 0.067 | 1.373 ± 0.029 |
5.35 ± 0.042 | 6.29 ± 0.056 |
4.07 ± 0.04 | 7.593 ± 0.059 |
1.869 ± 0.023 | 5.457 ± 0.037 |
5.009 ± 0.045 | 9.687 ± 0.065 |
Met |
Asn |
Gln |
Pro |
Arg |
Ser |
Thr |
Val |
Trp |
Tyr |
|---|---|---|---|---|---|---|---|---|---|
2.651 ± 0.027 | 3.316 ± 0.042 |
4.315 ± 0.049 | 3.307 ± 0.035 |
6.005 ± 0.058 | 5.875 ± 0.056 |
5.591 ± 0.05 | 7.853 ± 0.041 |
1.241 ± 0.021 | 2.52 ± 0.029 |
Most of the basic statistics you can see at this page can be downloaded from this CSV file
See this proteome in:

Proteome-pI is available under Creative Commons Attribution-NoDerivs license, for more details see here
| Reference: Kozlowski LP. Proteome-pI 2.0: Proteome Isoelectric Point Database Update. Nucleic Acids Res. 2021, doi: 10.1093/nar/gkab944 | Contact: Lukasz P. Kozlowski |