Subtercola sp. Z020
Taxonomy: cellular organisms; Bacteria; Terrabacteria group; Actinobacteria; Actinomycetia; Micrococcales; Microbacteriaceae; Subtercola; unclassified Subtercola
Average proteome isoelectric point is 6.05
Get precalculated fractions of proteins

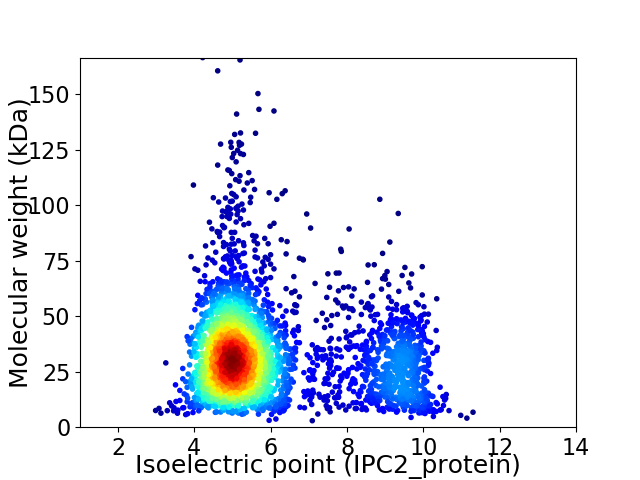
Virtual 2D-PAGE plot for 3250 proteins (isoelectric point calculated using IPC2_protein)
Get csv file with sequences according to given criteria:
* You can choose from 21 different methods for calculating isoelectric point
Summary statistics related to proteome-wise predictions


Protein with the lowest isoelectric point:
>tr|A0A2S5W0F2|A0A2S5W0F2_9MICO Sugar ABC transporter substrate-binding protein OS=Subtercola sp. Z020 OX=2080582 GN=C5B96_12865 PE=4 SV=1
MM1 pKa = 7.23NAFGEE6 pKa = 4.62SASMPVTSAAPAPSVTAASVTTGSLAGGTAVSLAGQGLGSVVSVSVGGVPATSVAIDD63 pKa = 3.68GEE65 pKa = 4.77GTVTFVTPPAADD77 pKa = 3.75YY78 pKa = 11.01QPAAAALSLANADD91 pKa = 3.55GTVVDD96 pKa = 4.13TGQTFTYY103 pKa = 9.69TAVTPVDD110 pKa = 3.33QQMQYY115 pKa = 11.66AFAHH119 pKa = 5.44WKK121 pKa = 10.27DD122 pKa = 3.63YY123 pKa = 11.49NLADD127 pKa = 3.18WSVFSDD133 pKa = 3.41NDD135 pKa = 3.38CGNFVNQTLVARR147 pKa = 11.84GWEE150 pKa = 4.19QNDD153 pKa = 3.07DD154 pKa = 3.28WYY156 pKa = 11.78SNYY159 pKa = 10.29GSGGDD164 pKa = 4.15YY165 pKa = 10.07SYY167 pKa = 11.7SWIRR171 pKa = 11.84GNEE174 pKa = 3.57MDD176 pKa = 5.58DD177 pKa = 3.96YY178 pKa = 11.35LDD180 pKa = 4.0SRR182 pKa = 11.84PEE184 pKa = 3.9TTRR187 pKa = 11.84LEE189 pKa = 4.31LSDD192 pKa = 3.8RR193 pKa = 11.84ASLKK197 pKa = 10.64IGDD200 pKa = 3.78VVMFDD205 pKa = 4.2WDD207 pKa = 3.77PQNDD211 pKa = 3.6NGVDD215 pKa = 3.22HH216 pKa = 6.9TMLVSRR222 pKa = 11.84VDD224 pKa = 3.66RR225 pKa = 11.84NADD228 pKa = 3.11GSVSVKK234 pKa = 9.91MVGHH238 pKa = 6.1TVDD241 pKa = 2.99AQYY244 pKa = 11.32RR245 pKa = 11.84DD246 pKa = 4.37LDD248 pKa = 3.8TAITVEE254 pKa = 4.29NPGGTAHH261 pKa = 7.19FYY263 pKa = 11.05SIAA266 pKa = 3.48
MM1 pKa = 7.23NAFGEE6 pKa = 4.62SASMPVTSAAPAPSVTAASVTTGSLAGGTAVSLAGQGLGSVVSVSVGGVPATSVAIDD63 pKa = 3.68GEE65 pKa = 4.77GTVTFVTPPAADD77 pKa = 3.75YY78 pKa = 11.01QPAAAALSLANADD91 pKa = 3.55GTVVDD96 pKa = 4.13TGQTFTYY103 pKa = 9.69TAVTPVDD110 pKa = 3.33QQMQYY115 pKa = 11.66AFAHH119 pKa = 5.44WKK121 pKa = 10.27DD122 pKa = 3.63YY123 pKa = 11.49NLADD127 pKa = 3.18WSVFSDD133 pKa = 3.41NDD135 pKa = 3.38CGNFVNQTLVARR147 pKa = 11.84GWEE150 pKa = 4.19QNDD153 pKa = 3.07DD154 pKa = 3.28WYY156 pKa = 11.78SNYY159 pKa = 10.29GSGGDD164 pKa = 4.15YY165 pKa = 10.07SYY167 pKa = 11.7SWIRR171 pKa = 11.84GNEE174 pKa = 3.57MDD176 pKa = 5.58DD177 pKa = 3.96YY178 pKa = 11.35LDD180 pKa = 4.0SRR182 pKa = 11.84PEE184 pKa = 3.9TTRR187 pKa = 11.84LEE189 pKa = 4.31LSDD192 pKa = 3.8RR193 pKa = 11.84ASLKK197 pKa = 10.64IGDD200 pKa = 3.78VVMFDD205 pKa = 4.2WDD207 pKa = 3.77PQNDD211 pKa = 3.6NGVDD215 pKa = 3.22HH216 pKa = 6.9TMLVSRR222 pKa = 11.84VDD224 pKa = 3.66RR225 pKa = 11.84NADD228 pKa = 3.11GSVSVKK234 pKa = 9.91MVGHH238 pKa = 6.1TVDD241 pKa = 2.99AQYY244 pKa = 11.32RR245 pKa = 11.84DD246 pKa = 4.37LDD248 pKa = 3.8TAITVEE254 pKa = 4.29NPGGTAHH261 pKa = 7.19FYY263 pKa = 11.05SIAA266 pKa = 3.48
Molecular weight: 28.08 kDa
Isoelectric point according different methods:
Protein with the highest isoelectric point:
>tr|A0A2S5W207|A0A2S5W207_9MICO ABC transporter permease OS=Subtercola sp. Z020 OX=2080582 GN=C5B96_11175 PE=4 SV=1
MM1 pKa = 7.4GSVIKK6 pKa = 10.42KK7 pKa = 8.47RR8 pKa = 11.84RR9 pKa = 11.84KK10 pKa = 9.22RR11 pKa = 11.84MAKK14 pKa = 9.41KK15 pKa = 9.87KK16 pKa = 9.7HH17 pKa = 5.84RR18 pKa = 11.84KK19 pKa = 8.56LLRR22 pKa = 11.84KK23 pKa = 7.78TRR25 pKa = 11.84HH26 pKa = 3.65QRR28 pKa = 11.84RR29 pKa = 11.84NKK31 pKa = 9.78KK32 pKa = 9.85
MM1 pKa = 7.4GSVIKK6 pKa = 10.42KK7 pKa = 8.47RR8 pKa = 11.84RR9 pKa = 11.84KK10 pKa = 9.22RR11 pKa = 11.84MAKK14 pKa = 9.41KK15 pKa = 9.87KK16 pKa = 9.7HH17 pKa = 5.84RR18 pKa = 11.84KK19 pKa = 8.56LLRR22 pKa = 11.84KK23 pKa = 7.78TRR25 pKa = 11.84HH26 pKa = 3.65QRR28 pKa = 11.84RR29 pKa = 11.84NKK31 pKa = 9.78KK32 pKa = 9.85
Molecular weight: 4.08 kDa
Isoelectric point according different methods:
Peptides (in silico digests for buttom-up proteomics)
Below you can find in silico digests of the whole proteome with Trypsin, Chymotrypsin, Trypsin+LysC, LysN, ArgC proteases suitable for different mass spec machines.| Try ESI |
 |
|---|
| ChTry ESI |
 |
|---|
| ArgC ESI |
 |
|---|
| LysN ESI |
 |
|---|
| TryLysC ESI |
 |
|---|
| Try MALDI |
 |
|---|
| ChTry MALDI |
 |
|---|
| ArgC MALDI |
 |
|---|
| LysN MALDI |
 |
|---|
| TryLysC MALDI |
 |
|---|
| Try LTQ |
 |
|---|
| ChTry LTQ |
 |
|---|
| ArgC LTQ |
 |
|---|
| LysN LTQ |
 |
|---|
| TryLysC LTQ |
 |
|---|
| Try MSlow |
 |
|---|
| ChTry MSlow |
 |
|---|
| ArgC MSlow |
 |
|---|
| LysN MSlow |
 |
|---|
| TryLysC MSlow |
 |
|---|
| Try MShigh |
 |
|---|
| ChTry MShigh |
 |
|---|
| ArgC MShigh |
 |
|---|
| LysN MShigh |
 |
|---|
| TryLysC MShigh |
 |
|---|
General Statistics
Number of major isoforms |
Number of additional isoforms |
Number of all proteins |
Number of amino acids |
Min. Seq. Length |
Max. Seq. Length |
Avg. Seq. Length |
Avg. Mol. Weight |
|---|---|---|---|---|---|---|---|
0 |
1047158 |
29 |
1637 |
322.2 |
34.21 |
Amino acid frequency
Ala |
Cys |
Asp |
Glu |
Phe |
Gly |
His |
Ile |
Lys |
Leu |
|---|---|---|---|---|---|---|---|---|---|
13.566 ± 0.07 | 0.472 ± 0.01 |
5.852 ± 0.031 | 5.176 ± 0.044 |
3.263 ± 0.028 | 9.122 ± 0.04 |
1.878 ± 0.022 | 4.547 ± 0.034 |
2.041 ± 0.029 | 10.267 ± 0.051 |
Met |
Asn |
Gln |
Pro |
Arg |
Ser |
Thr |
Val |
Trp |
Tyr |
|---|---|---|---|---|---|---|---|---|---|
1.632 ± 0.014 | 2.223 ± 0.024 |
5.479 ± 0.032 | 2.839 ± 0.024 |
6.691 ± 0.047 | 6.389 ± 0.033 |
6.351 ± 0.045 | 8.869 ± 0.034 |
1.325 ± 0.018 | 2.017 ± 0.02 |
Most of the basic statistics you can see at this page can be downloaded from this CSV file
Proteome-pI is available under Creative Commons Attribution-NoDerivs license, for more details see here
| Reference: Kozlowski LP. Proteome-pI 2.0: Proteome Isoelectric Point Database Update. Nucleic Acids Res. 2021, doi: 10.1093/nar/gkab944 | Contact: Lukasz P. Kozlowski |
