Ohtaekwangia koreensis
Taxonomy: cellular organisms; Bacteria; FCB group; Bacteroidetes/Chlorobi group; Bacteroidetes; Cytophagia; Cytophagales; Fulvivirgaceae; Ohtaekwangia
Average proteome isoelectric point is 6.69
Get precalculated fractions of proteins

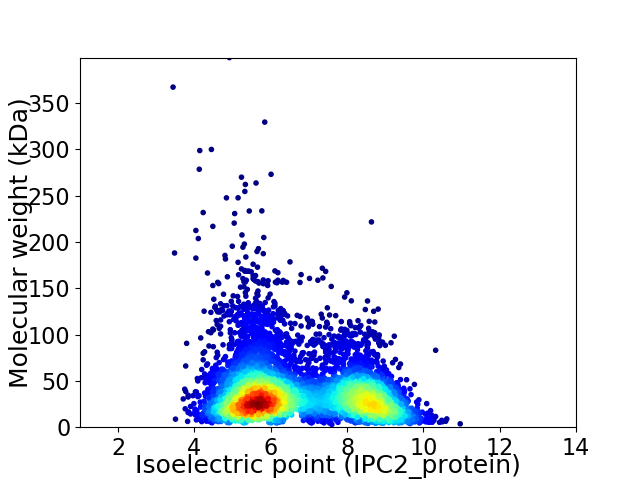
Virtual 2D-PAGE plot for 5828 proteins (isoelectric point calculated using IPC2_protein)
Get csv file with sequences according to given criteria:
* You can choose from 21 different methods for calculating isoelectric point
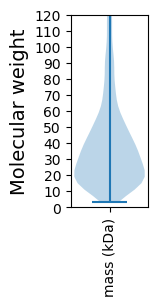
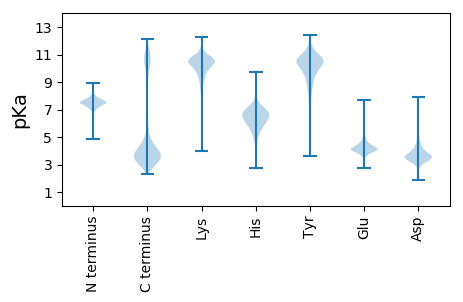
Summary statistics related to proteome-wise predictions


Protein with the lowest isoelectric point:
>tr|A0A1T5J050|A0A1T5J050_9BACT Small ribosomal subunit biogenesis GTPase RsgA OS=Ohtaekwangia koreensis OX=688867 GN=rsgA PE=3 SV=1
MM1 pKa = 7.67KK2 pKa = 10.72NNLLLSGAFCALTFFASCSDD22 pKa = 3.71DD23 pKa = 4.87DD24 pKa = 4.47IPAIEE29 pKa = 4.27YY30 pKa = 10.4KK31 pKa = 10.56EE32 pKa = 3.86QGFVKK37 pKa = 10.6GQITGTASDD46 pKa = 4.45DD47 pKa = 3.25ATAINEE53 pKa = 4.09SFSYY57 pKa = 10.52SKK59 pKa = 11.09YY60 pKa = 9.68NPGYY64 pKa = 10.09FDD66 pKa = 4.76GPYY69 pKa = 10.26ASNYY73 pKa = 8.43VVNDD77 pKa = 3.2NGTIDD82 pKa = 3.61INIVRR87 pKa = 11.84QDD89 pKa = 3.41VQGGGGVYY97 pKa = 10.2INLLLDD103 pKa = 4.08GPGDD107 pKa = 3.52TSPAYY112 pKa = 9.49EE113 pKa = 4.54VEE115 pKa = 3.73LTYY118 pKa = 10.57IKK120 pKa = 10.66EE121 pKa = 4.08SDD123 pKa = 3.55KK124 pKa = 10.88ILYY127 pKa = 10.03FSTEE131 pKa = 3.72SDD133 pKa = 3.28SDD135 pKa = 3.98NEE137 pKa = 4.15SDD139 pKa = 3.63VTNFSFDD146 pKa = 3.32ATSGRR151 pKa = 11.84VKK153 pKa = 10.99GEE155 pKa = 3.46FSIEE159 pKa = 3.93GSDD162 pKa = 3.81NSTNNDD168 pKa = 2.86ATVTGSFDD176 pKa = 3.56VVVKK180 pKa = 8.96QVIQQ184 pKa = 3.35
MM1 pKa = 7.67KK2 pKa = 10.72NNLLLSGAFCALTFFASCSDD22 pKa = 3.71DD23 pKa = 4.87DD24 pKa = 4.47IPAIEE29 pKa = 4.27YY30 pKa = 10.4KK31 pKa = 10.56EE32 pKa = 3.86QGFVKK37 pKa = 10.6GQITGTASDD46 pKa = 4.45DD47 pKa = 3.25ATAINEE53 pKa = 4.09SFSYY57 pKa = 10.52SKK59 pKa = 11.09YY60 pKa = 9.68NPGYY64 pKa = 10.09FDD66 pKa = 4.76GPYY69 pKa = 10.26ASNYY73 pKa = 8.43VVNDD77 pKa = 3.2NGTIDD82 pKa = 3.61INIVRR87 pKa = 11.84QDD89 pKa = 3.41VQGGGGVYY97 pKa = 10.2INLLLDD103 pKa = 4.08GPGDD107 pKa = 3.52TSPAYY112 pKa = 9.49EE113 pKa = 4.54VEE115 pKa = 3.73LTYY118 pKa = 10.57IKK120 pKa = 10.66EE121 pKa = 4.08SDD123 pKa = 3.55KK124 pKa = 10.88ILYY127 pKa = 10.03FSTEE131 pKa = 3.72SDD133 pKa = 3.28SDD135 pKa = 3.98NEE137 pKa = 4.15SDD139 pKa = 3.63VTNFSFDD146 pKa = 3.32ATSGRR151 pKa = 11.84VKK153 pKa = 10.99GEE155 pKa = 3.46FSIEE159 pKa = 3.93GSDD162 pKa = 3.81NSTNNDD168 pKa = 2.86ATVTGSFDD176 pKa = 3.56VVVKK180 pKa = 8.96QVIQQ184 pKa = 3.35
Molecular weight: 19.85 kDa
Isoelectric point according different methods:
Protein with the highest isoelectric point:
>tr|A0A1T5LHQ2|A0A1T5LHQ2_9BACT Lipid A Biosynthesis N-terminal domain-containing protein OS=Ohtaekwangia koreensis OX=688867 GN=SAMN05660236_3259 PE=4 SV=1
MM1 pKa = 7.84PSGKK5 pKa = 9.41KK6 pKa = 9.45RR7 pKa = 11.84KK8 pKa = 6.94KK9 pKa = 10.11HH10 pKa = 5.69KK11 pKa = 9.8MATHH15 pKa = 6.02KK16 pKa = 10.33RR17 pKa = 11.84KK18 pKa = 9.84KK19 pKa = 9.28RR20 pKa = 11.84LRR22 pKa = 11.84KK23 pKa = 9.26NRR25 pKa = 11.84HH26 pKa = 4.71KK27 pKa = 10.87KK28 pKa = 9.36KK29 pKa = 10.77
MM1 pKa = 7.84PSGKK5 pKa = 9.41KK6 pKa = 9.45RR7 pKa = 11.84KK8 pKa = 6.94KK9 pKa = 10.11HH10 pKa = 5.69KK11 pKa = 9.8MATHH15 pKa = 6.02KK16 pKa = 10.33RR17 pKa = 11.84KK18 pKa = 9.84KK19 pKa = 9.28RR20 pKa = 11.84LRR22 pKa = 11.84KK23 pKa = 9.26NRR25 pKa = 11.84HH26 pKa = 4.71KK27 pKa = 10.87KK28 pKa = 9.36KK29 pKa = 10.77
Molecular weight: 3.65 kDa
Isoelectric point according different methods:
Peptides (in silico digests for buttom-up proteomics)
Below you can find in silico digests of the whole proteome with Trypsin, Chymotrypsin, Trypsin+LysC, LysN, ArgC proteases suitable for different mass spec machines.| Try ESI |
 |
|---|
| ChTry ESI |
 |
|---|
| ArgC ESI |
 |
|---|
| LysN ESI |
 |
|---|
| TryLysC ESI |
 |
|---|
| Try MALDI |
 |
|---|
| ChTry MALDI |
 |
|---|
| ArgC MALDI |
 |
|---|
| LysN MALDI |
 |
|---|
| TryLysC MALDI |
 |
|---|
| Try LTQ |
 |
|---|
| ChTry LTQ |
 |
|---|
| ArgC LTQ |
 |
|---|
| LysN LTQ |
 |
|---|
| TryLysC LTQ |
 |
|---|
| Try MSlow |
 |
|---|
| ChTry MSlow |
 |
|---|
| ArgC MSlow |
 |
|---|
| LysN MSlow |
 |
|---|
| TryLysC MSlow |
 |
|---|
| Try MShigh |
 |
|---|
| ChTry MShigh |
 |
|---|
| ArgC MShigh |
 |
|---|
| LysN MShigh |
 |
|---|
| TryLysC MShigh |
 |
|---|
General Statistics
Number of major isoforms |
Number of additional isoforms |
Number of all proteins |
Number of amino acids |
Min. Seq. Length |
Max. Seq. Length |
Avg. Seq. Length |
Avg. Mol. Weight |
|---|---|---|---|---|---|---|---|
0 |
2158248 |
25 |
3719 |
370.3 |
41.59 |
Amino acid frequency
Ala |
Cys |
Asp |
Glu |
Phe |
Gly |
His |
Ile |
Lys |
Leu |
|---|---|---|---|---|---|---|---|---|---|
7.141 ± 0.032 | 0.755 ± 0.009 |
5.428 ± 0.023 | 5.968 ± 0.037 |
4.886 ± 0.024 | 6.698 ± 0.034 |
1.894 ± 0.015 | 7.354 ± 0.03 |
6.763 ± 0.04 | 9.256 ± 0.041 |
Met |
Asn |
Gln |
Pro |
Arg |
Ser |
Thr |
Val |
Trp |
Tyr |
|---|---|---|---|---|---|---|---|---|---|
2.167 ± 0.015 | 5.276 ± 0.029 |
3.719 ± 0.018 | 3.685 ± 0.018 |
4.169 ± 0.022 | 6.784 ± 0.03 |
6.134 ± 0.049 | 6.537 ± 0.024 |
1.244 ± 0.012 | 4.143 ± 0.025 |
Most of the basic statistics you can see at this page can be downloaded from this CSV file
Proteome-pI is available under Creative Commons Attribution-NoDerivs license, for more details see here
| Reference: Kozlowski LP. Proteome-pI 2.0: Proteome Isoelectric Point Database Update. Nucleic Acids Res. 2021, doi: 10.1093/nar/gkab944 | Contact: Lukasz P. Kozlowski |
