Hosta virus X
Taxonomy: Viruses; Riboviria; Orthornavirae; Kitrinoviricota; Alsuviricetes; Tymovirales; Alphaflexiviridae; Potexvirus
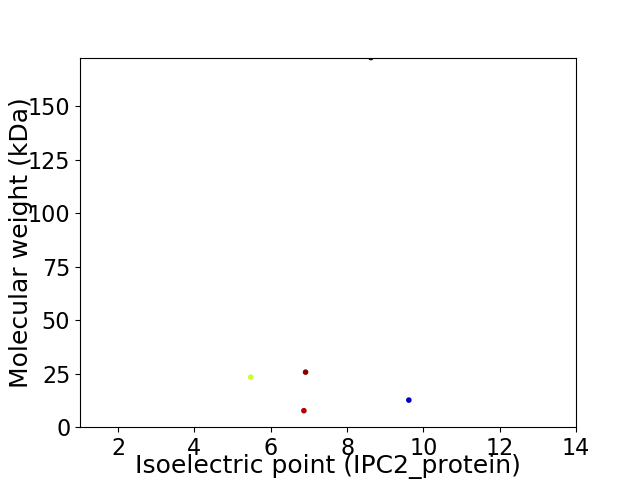
Average proteome isoelectric point is 7.57
Get precalculated fractions of proteins

Virtual 2D-PAGE plot for 5 proteins (isoelectric point calculated using IPC2_protein)
Get csv file with sequences according to given criteria:
* You can choose from 21 different methods for calculating isoelectric point
Summary statistics related to proteome-wise predictions


Protein with the lowest isoelectric point:
>tr|Q6Y594|Q6Y594_9VIRU Movement protein TGBp3 OS=Hosta virus X OX=214439 GN=TGB3 PE=3 SV=1
MM1 pKa = 7.55ASDD4 pKa = 4.59APTPPAAPSPVTFTAPTQEE23 pKa = 4.07QLTSLALPIISTRR36 pKa = 11.84LPSPDD41 pKa = 3.38VLNQISVKK49 pKa = 8.05WQEE52 pKa = 4.2LGVPTASISSTAIALCMACYY72 pKa = 10.12HH73 pKa = 6.44SGSSGSTLIPGLAPGTTVNYY93 pKa = 8.55TSLAAAVKK101 pKa = 10.27SLATLRR107 pKa = 11.84EE108 pKa = 3.94FARR111 pKa = 11.84YY112 pKa = 7.38FAPIIWNYY120 pKa = 10.45AIEE123 pKa = 4.58HH124 pKa = 6.88KK125 pKa = 10.53IPPANWAAMGYY136 pKa = 9.85KK137 pKa = 10.38EE138 pKa = 4.08NTKK141 pKa = 10.42YY142 pKa = 10.87AAFDD146 pKa = 3.61TFDD149 pKa = 4.85SILNPAALQPTGGLIRR165 pKa = 11.84QPTEE169 pKa = 3.8EE170 pKa = 4.69EE171 pKa = 4.17LLAHH175 pKa = 5.84QANSALHH182 pKa = 6.52IFDD185 pKa = 4.2SLRR188 pKa = 11.84NDD190 pKa = 3.75FASTDD195 pKa = 3.26GRR197 pKa = 11.84VTRR200 pKa = 11.84GHH202 pKa = 5.86ITSNVNSLNYY212 pKa = 10.27LPAPEE217 pKa = 4.91GSSS220 pKa = 3.17
MM1 pKa = 7.55ASDD4 pKa = 4.59APTPPAAPSPVTFTAPTQEE23 pKa = 4.07QLTSLALPIISTRR36 pKa = 11.84LPSPDD41 pKa = 3.38VLNQISVKK49 pKa = 8.05WQEE52 pKa = 4.2LGVPTASISSTAIALCMACYY72 pKa = 10.12HH73 pKa = 6.44SGSSGSTLIPGLAPGTTVNYY93 pKa = 8.55TSLAAAVKK101 pKa = 10.27SLATLRR107 pKa = 11.84EE108 pKa = 3.94FARR111 pKa = 11.84YY112 pKa = 7.38FAPIIWNYY120 pKa = 10.45AIEE123 pKa = 4.58HH124 pKa = 6.88KK125 pKa = 10.53IPPANWAAMGYY136 pKa = 9.85KK137 pKa = 10.38EE138 pKa = 4.08NTKK141 pKa = 10.42YY142 pKa = 10.87AAFDD146 pKa = 3.61TFDD149 pKa = 4.85SILNPAALQPTGGLIRR165 pKa = 11.84QPTEE169 pKa = 3.8EE170 pKa = 4.69EE171 pKa = 4.17LLAHH175 pKa = 5.84QANSALHH182 pKa = 6.52IFDD185 pKa = 4.2SLRR188 pKa = 11.84NDD190 pKa = 3.75FASTDD195 pKa = 3.26GRR197 pKa = 11.84VTRR200 pKa = 11.84GHH202 pKa = 5.86ITSNVNSLNYY212 pKa = 10.27LPAPEE217 pKa = 4.91GSSS220 pKa = 3.17
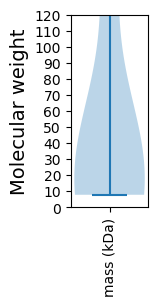
Molecular weight: 23.37 kDa
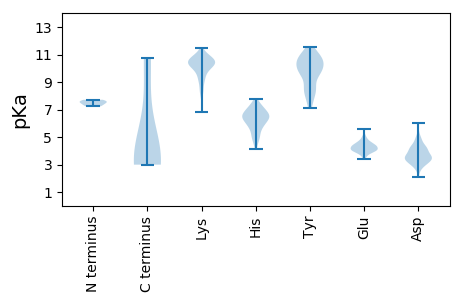
Isoelectric point according different methods:
Protein with the highest isoelectric point:
>tr|Q5GR28|Q5GR28_9VIRU ORF1 protein OS=Hosta virus X OX=214439 GN=Xgp1 PE=4 SV=1
MM1 pKa = 7.57SSPHH5 pKa = 7.02RR6 pKa = 11.84LTPPPNYY13 pKa = 9.78TPVLLAVVIGVGLAVVTNQLTRR35 pKa = 11.84STLPHH40 pKa = 6.64VGDD43 pKa = 4.96NIHH46 pKa = 6.38SLPHH50 pKa = 5.72GGNYY54 pKa = 9.71KK55 pKa = 10.74DD56 pKa = 3.58GTKK59 pKa = 10.4SVIYY63 pKa = 9.98RR64 pKa = 11.84GPAPFQRR71 pKa = 11.84SHH73 pKa = 5.15STAPPFNAVLLLTFAIWFLSCRR95 pKa = 11.84TRR97 pKa = 11.84RR98 pKa = 11.84AAIGIHH104 pKa = 5.2VCHH107 pKa = 6.45TCSQTRR113 pKa = 11.84EE114 pKa = 4.03QQQ116 pKa = 2.99
MM1 pKa = 7.57SSPHH5 pKa = 7.02RR6 pKa = 11.84LTPPPNYY13 pKa = 9.78TPVLLAVVIGVGLAVVTNQLTRR35 pKa = 11.84STLPHH40 pKa = 6.64VGDD43 pKa = 4.96NIHH46 pKa = 6.38SLPHH50 pKa = 5.72GGNYY54 pKa = 9.71KK55 pKa = 10.74DD56 pKa = 3.58GTKK59 pKa = 10.4SVIYY63 pKa = 9.98RR64 pKa = 11.84GPAPFQRR71 pKa = 11.84SHH73 pKa = 5.15STAPPFNAVLLLTFAIWFLSCRR95 pKa = 11.84TRR97 pKa = 11.84RR98 pKa = 11.84AAIGIHH104 pKa = 5.2VCHH107 pKa = 6.45TCSQTRR113 pKa = 11.84EE114 pKa = 4.03QQQ116 pKa = 2.99
Molecular weight: 12.66 kDa
Isoelectric point according different methods:
Peptides (in silico digests for buttom-up proteomics)
Below you can find in silico digests of the whole proteome with Trypsin, Chymotrypsin, Trypsin+LysC, LysN, ArgC proteases suitable for different mass spec machines.| Try ESI |
 |
|---|
| ChTry ESI |
 |
|---|
| ArgC ESI |
 |
|---|
| LysN ESI |
 |
|---|
| TryLysC ESI |
 |
|---|
| Try MALDI |
 |
|---|
| ChTry MALDI |
 |
|---|
| ArgC MALDI |
 |
|---|
| LysN MALDI |
 |
|---|
| TryLysC MALDI |
 |
|---|
| Try LTQ |
 |
|---|
| ChTry LTQ |
 |
|---|
| ArgC LTQ |
 |
|---|
| LysN LTQ |
 |
|---|
| TryLysC LTQ |
 |
|---|
| Try MSlow |
 |
|---|
| ChTry MSlow |
 |
|---|
| ArgC MSlow |
 |
|---|
| LysN MSlow |
 |
|---|
| TryLysC MSlow |
 |
|---|
| Try MShigh |
 |
|---|
| ChTry MShigh |
 |
|---|
| ArgC MShigh |
 |
|---|
| LysN MShigh |
 |
|---|
| TryLysC MShigh |
 |
|---|
General Statistics
Number of major isoforms |
Number of additional isoforms |
Number of all proteins |
Number of amino acids |
Min. Seq. Length |
Max. Seq. Length |
Avg. Seq. Length |
Avg. Mol. Weight |
|---|---|---|---|---|---|---|---|
0 |
2147 |
74 |
1507 |
429.4 |
48.42 |
Amino acid frequency
Ala |
Cys |
Asp |
Glu |
Phe |
Gly |
His |
Ile |
Lys |
Leu |
|---|---|---|---|---|---|---|---|---|---|
8.058 ± 1.758 | 1.49 ± 0.641 |
4.332 ± 0.808 | 5.589 ± 1.275 |
4.658 ± 0.581 | 4.984 ± 0.673 |
3.354 ± 0.571 | 5.217 ± 0.385 |
6.195 ± 2.178 | 9.688 ± 1.108 |
Met |
Asn |
Gln |
Pro |
Arg |
Ser |
Thr |
Val |
Trp |
Tyr |
|---|---|---|---|---|---|---|---|---|---|
1.677 ± 0.415 | 4.285 ± 0.526 |
7.266 ± 0.929 | 4.565 ± 1.079 |
5.822 ± 0.768 | 6.148 ± 1.558 |
7.965 ± 0.574 | 4.471 ± 0.898 |
1.304 ± 0.32 | 2.934 ± 0.195 |
Most of the basic statistics you can see at this page can be downloaded from this CSV file
Proteome-pI is available under Creative Commons Attribution-NoDerivs license, for more details see here
| Reference: Kozlowski LP. Proteome-pI 2.0: Proteome Isoelectric Point Database Update. Nucleic Acids Res. 2021, doi: 10.1093/nar/gkab944 | Contact: Lukasz P. Kozlowski |
