Mycetocola zhujimingii
Taxonomy: cellular organisms; Bacteria; Terrabacteria group; Actinobacteria; Actinomycetia; Micrococcales; Microbacteriaceae; Mycetocola
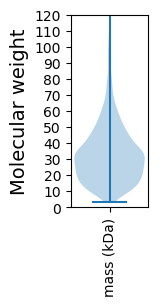
Average proteome isoelectric point is 5.96
Get precalculated fractions of proteins

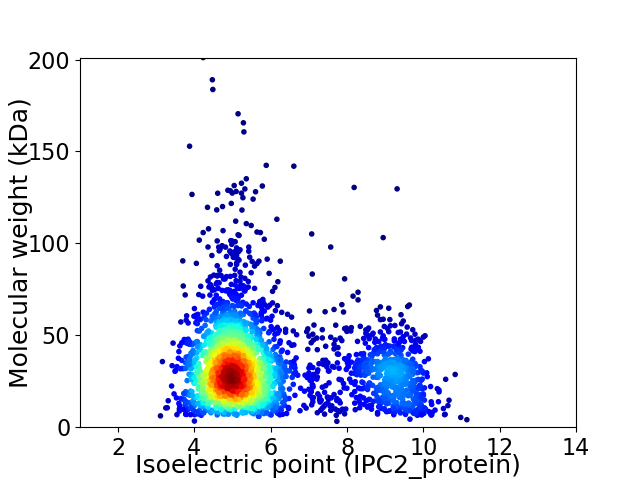
Virtual 2D-PAGE plot for 2928 proteins (isoelectric point calculated using IPC2_protein)
Get csv file with sequences according to given criteria:
* You can choose from 21 different methods for calculating isoelectric point
Summary statistics related to proteome-wise predictions


Protein with the lowest isoelectric point:
>tr|A0A2U1TBR1|A0A2U1TBR1_9MICO Uncharacterized protein OS=Mycetocola zhujimingii OX=2079792 GN=DF223_11975 PE=4 SV=1
MM1 pKa = 7.58NIGSRR6 pKa = 11.84ITAAAALSVGIVALTGCTAAEE27 pKa = 3.83NSAALEE33 pKa = 4.35NGDD36 pKa = 4.14EE37 pKa = 4.34KK38 pKa = 11.25DD39 pKa = 3.38VSIAVFNGWDD49 pKa = 3.46EE50 pKa = 4.32AVATSVLWEE59 pKa = 4.94SILADD64 pKa = 3.11KK65 pKa = 11.02GYY67 pKa = 11.02DD68 pKa = 3.44VTLDD72 pKa = 3.67YY73 pKa = 11.46ADD75 pKa = 4.7PAPVFAGLAAGDD87 pKa = 3.79YY88 pKa = 10.44DD89 pKa = 3.7ATLDD93 pKa = 3.22VWLPFTHH100 pKa = 7.38KK101 pKa = 10.63SYY103 pKa = 11.14LDD105 pKa = 3.65EE106 pKa = 5.34YY107 pKa = 11.05GDD109 pKa = 5.32DD110 pKa = 3.77IVEE113 pKa = 4.15LGAWNNEE120 pKa = 3.69GKK122 pKa = 10.08NAIAVNADD130 pKa = 3.22APIDD134 pKa = 3.88SLAEE138 pKa = 3.83LAEE141 pKa = 4.2NADD144 pKa = 3.7LFGNKK149 pKa = 8.34IVGIEE154 pKa = 3.99PGAGLTMATEE164 pKa = 4.17EE165 pKa = 4.4RR166 pKa = 11.84VIPTYY171 pKa = 10.79GLEE174 pKa = 4.0DD175 pKa = 3.57MEE177 pKa = 5.02YY178 pKa = 8.49VTSSTSAMLTEE189 pKa = 4.59LTSATKK195 pKa = 10.34AGEE198 pKa = 4.34NIAVTLWEE206 pKa = 4.04PHH208 pKa = 4.33WAYY211 pKa = 10.89GEE213 pKa = 4.05FALKK217 pKa = 10.52NLEE220 pKa = 4.32DD221 pKa = 3.99PEE223 pKa = 4.66GALGAVEE230 pKa = 4.91TIHH233 pKa = 7.12AYY235 pKa = 10.59ASTDD239 pKa = 3.53FSEE242 pKa = 4.51SHH244 pKa = 6.06PTAAGWLSDD253 pKa = 4.13FEE255 pKa = 4.49MDD257 pKa = 5.48LDD259 pKa = 3.99TLYY262 pKa = 11.37SLEE265 pKa = 4.05KK266 pKa = 10.84VLFVDD271 pKa = 5.0YY272 pKa = 11.21DD273 pKa = 3.97GDD275 pKa = 3.91DD276 pKa = 3.52YY277 pKa = 12.13APIVEE282 pKa = 5.31KK283 pKa = 10.12WIEE286 pKa = 3.97DD287 pKa = 3.16NRR289 pKa = 11.84EE290 pKa = 3.97YY291 pKa = 11.54VDD293 pKa = 4.19GLTSS297 pKa = 3.2
MM1 pKa = 7.58NIGSRR6 pKa = 11.84ITAAAALSVGIVALTGCTAAEE27 pKa = 3.83NSAALEE33 pKa = 4.35NGDD36 pKa = 4.14EE37 pKa = 4.34KK38 pKa = 11.25DD39 pKa = 3.38VSIAVFNGWDD49 pKa = 3.46EE50 pKa = 4.32AVATSVLWEE59 pKa = 4.94SILADD64 pKa = 3.11KK65 pKa = 11.02GYY67 pKa = 11.02DD68 pKa = 3.44VTLDD72 pKa = 3.67YY73 pKa = 11.46ADD75 pKa = 4.7PAPVFAGLAAGDD87 pKa = 3.79YY88 pKa = 10.44DD89 pKa = 3.7ATLDD93 pKa = 3.22VWLPFTHH100 pKa = 7.38KK101 pKa = 10.63SYY103 pKa = 11.14LDD105 pKa = 3.65EE106 pKa = 5.34YY107 pKa = 11.05GDD109 pKa = 5.32DD110 pKa = 3.77IVEE113 pKa = 4.15LGAWNNEE120 pKa = 3.69GKK122 pKa = 10.08NAIAVNADD130 pKa = 3.22APIDD134 pKa = 3.88SLAEE138 pKa = 3.83LAEE141 pKa = 4.2NADD144 pKa = 3.7LFGNKK149 pKa = 8.34IVGIEE154 pKa = 3.99PGAGLTMATEE164 pKa = 4.17EE165 pKa = 4.4RR166 pKa = 11.84VIPTYY171 pKa = 10.79GLEE174 pKa = 4.0DD175 pKa = 3.57MEE177 pKa = 5.02YY178 pKa = 8.49VTSSTSAMLTEE189 pKa = 4.59LTSATKK195 pKa = 10.34AGEE198 pKa = 4.34NIAVTLWEE206 pKa = 4.04PHH208 pKa = 4.33WAYY211 pKa = 10.89GEE213 pKa = 4.05FALKK217 pKa = 10.52NLEE220 pKa = 4.32DD221 pKa = 3.99PEE223 pKa = 4.66GALGAVEE230 pKa = 4.91TIHH233 pKa = 7.12AYY235 pKa = 10.59ASTDD239 pKa = 3.53FSEE242 pKa = 4.51SHH244 pKa = 6.06PTAAGWLSDD253 pKa = 4.13FEE255 pKa = 4.49MDD257 pKa = 5.48LDD259 pKa = 3.99TLYY262 pKa = 11.37SLEE265 pKa = 4.05KK266 pKa = 10.84VLFVDD271 pKa = 5.0YY272 pKa = 11.21DD273 pKa = 3.97GDD275 pKa = 3.91DD276 pKa = 3.52YY277 pKa = 12.13APIVEE282 pKa = 5.31KK283 pKa = 10.12WIEE286 pKa = 3.97DD287 pKa = 3.16NRR289 pKa = 11.84EE290 pKa = 3.97YY291 pKa = 11.54VDD293 pKa = 4.19GLTSS297 pKa = 3.2
Molecular weight: 31.87 kDa
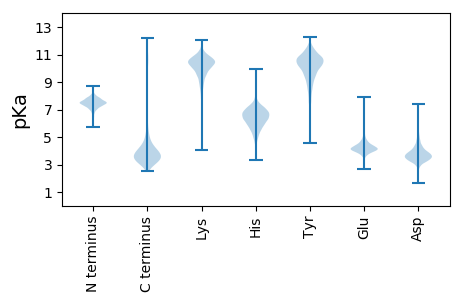
Isoelectric point according different methods:
Protein with the highest isoelectric point:
>tr|A0A2U1TAE4|A0A2U1TAE4_9MICO ATPase OS=Mycetocola zhujimingii OX=2079792 GN=DF223_14490 PE=4 SV=1
MM1 pKa = 7.4GSVIKK6 pKa = 10.42KK7 pKa = 8.47RR8 pKa = 11.84RR9 pKa = 11.84KK10 pKa = 9.22RR11 pKa = 11.84MAKK14 pKa = 9.41KK15 pKa = 9.87KK16 pKa = 9.7HH17 pKa = 5.84RR18 pKa = 11.84KK19 pKa = 8.56LLRR22 pKa = 11.84KK23 pKa = 7.78TRR25 pKa = 11.84HH26 pKa = 3.65QRR28 pKa = 11.84RR29 pKa = 11.84NKK31 pKa = 9.78KK32 pKa = 9.85
MM1 pKa = 7.4GSVIKK6 pKa = 10.42KK7 pKa = 8.47RR8 pKa = 11.84RR9 pKa = 11.84KK10 pKa = 9.22RR11 pKa = 11.84MAKK14 pKa = 9.41KK15 pKa = 9.87KK16 pKa = 9.7HH17 pKa = 5.84RR18 pKa = 11.84KK19 pKa = 8.56LLRR22 pKa = 11.84KK23 pKa = 7.78TRR25 pKa = 11.84HH26 pKa = 3.65QRR28 pKa = 11.84RR29 pKa = 11.84NKK31 pKa = 9.78KK32 pKa = 9.85
Molecular weight: 4.08 kDa
Isoelectric point according different methods:
Peptides (in silico digests for buttom-up proteomics)
Below you can find in silico digests of the whole proteome with Trypsin, Chymotrypsin, Trypsin+LysC, LysN, ArgC proteases suitable for different mass spec machines.| Try ESI |
 |
|---|
| ChTry ESI |
 |
|---|
| ArgC ESI |
 |
|---|
| LysN ESI |
 |
|---|
| TryLysC ESI |
 |
|---|
| Try MALDI |
 |
|---|
| ChTry MALDI |
 |
|---|
| ArgC MALDI |
 |
|---|
| LysN MALDI |
 |
|---|
| TryLysC MALDI |
 |
|---|
| Try LTQ |
 |
|---|
| ChTry LTQ |
 |
|---|
| ArgC LTQ |
 |
|---|
| LysN LTQ |
 |
|---|
| TryLysC LTQ |
 |
|---|
| Try MSlow |
 |
|---|
| ChTry MSlow |
 |
|---|
| ArgC MSlow |
 |
|---|
| LysN MSlow |
 |
|---|
| TryLysC MSlow |
 |
|---|
| Try MShigh |
 |
|---|
| ChTry MShigh |
 |
|---|
| ArgC MShigh |
 |
|---|
| LysN MShigh |
 |
|---|
| TryLysC MShigh |
 |
|---|
General Statistics
Number of major isoforms |
Number of additional isoforms |
Number of all proteins |
Number of amino acids |
Min. Seq. Length |
Max. Seq. Length |
Avg. Seq. Length |
Avg. Mol. Weight |
|---|---|---|---|---|---|---|---|
0 |
942499 |
29 |
1940 |
321.9 |
34.51 |
Amino acid frequency
Ala |
Cys |
Asp |
Glu |
Phe |
Gly |
His |
Ile |
Lys |
Leu |
|---|---|---|---|---|---|---|---|---|---|
12.545 ± 0.057 | 0.477 ± 0.01 |
6.15 ± 0.038 | 5.711 ± 0.041 |
3.319 ± 0.027 | 8.732 ± 0.04 |
1.867 ± 0.021 | 4.971 ± 0.036 |
2.334 ± 0.037 | 10.13 ± 0.049 |
Met |
Asn |
Gln |
Pro |
Arg |
Ser |
Thr |
Val |
Trp |
Tyr |
|---|---|---|---|---|---|---|---|---|---|
1.794 ± 0.015 | 2.363 ± 0.025 |
5.252 ± 0.031 | 2.796 ± 0.022 |
6.696 ± 0.041 | 6.268 ± 0.036 |
6.308 ± 0.033 | 8.788 ± 0.039 |
1.447 ± 0.022 | 2.055 ± 0.022 |
Most of the basic statistics you can see at this page can be downloaded from this CSV file
Proteome-pI is available under Creative Commons Attribution-NoDerivs license, for more details see here
| Reference: Kozlowski LP. Proteome-pI 2.0: Proteome Isoelectric Point Database Update. Nucleic Acids Res. 2021, doi: 10.1093/nar/gkab944 | Contact: Lukasz P. Kozlowski |
