Solirubrobacter pauli
Taxonomy: cellular organisms; Bacteria; Terrabacteria group; Actinobacteria; Thermoleophilia; Solirubrobacterales; Solirubrobacteraceae; Solirubrobacter
Average proteome isoelectric point is 6.24
Get precalculated fractions of proteins
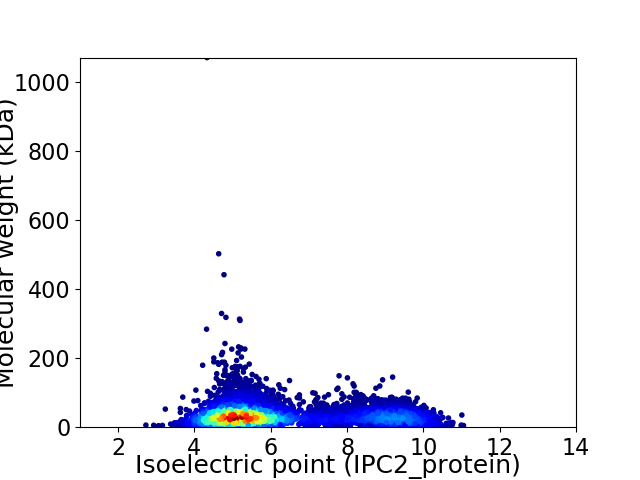
Virtual 2D-PAGE plot for 6590 proteins (isoelectric point calculated using IPC2_protein)
Get csv file with sequences according to given criteria:
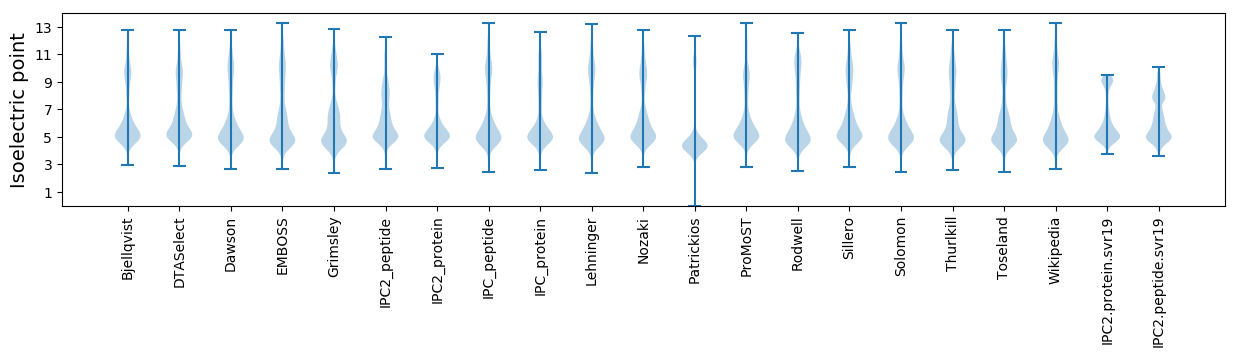
* You can choose from 21 different methods for calculating isoelectric point
Summary statistics related to proteome-wise predictions
Protein with the lowest isoelectric point:
>tr|A0A660LKA1|A0A660LKA1_9ACTN Protein-glutamate O-methyltransferase OS=Solirubrobacter pauli OX=166793 GN=C8N24_3799 PE=4 SV=1
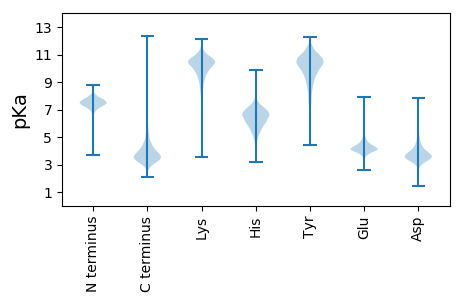
MM1 pKa = 7.1STDD4 pKa = 3.52TDD6 pKa = 3.84RR7 pKa = 11.84QWICEE12 pKa = 4.23SCGFIYY18 pKa = 10.53DD19 pKa = 4.23PEE21 pKa = 5.34EE22 pKa = 4.39GDD24 pKa = 3.43PDD26 pKa = 3.89GGIDD30 pKa = 3.57EE31 pKa = 4.59GTAFEE36 pKa = 6.05DD37 pKa = 4.77IPKK40 pKa = 10.35DD41 pKa = 3.37WYY43 pKa = 11.22CPVCGARR50 pKa = 11.84KK51 pKa = 9.67ADD53 pKa = 4.28FSPFEE58 pKa = 4.08GG59 pKa = 3.96
MM1 pKa = 7.1STDD4 pKa = 3.52TDD6 pKa = 3.84RR7 pKa = 11.84QWICEE12 pKa = 4.23SCGFIYY18 pKa = 10.53DD19 pKa = 4.23PEE21 pKa = 5.34EE22 pKa = 4.39GDD24 pKa = 3.43PDD26 pKa = 3.89GGIDD30 pKa = 3.57EE31 pKa = 4.59GTAFEE36 pKa = 6.05DD37 pKa = 4.77IPKK40 pKa = 10.35DD41 pKa = 3.37WYY43 pKa = 11.22CPVCGARR50 pKa = 11.84KK51 pKa = 9.67ADD53 pKa = 4.28FSPFEE58 pKa = 4.08GG59 pKa = 3.96
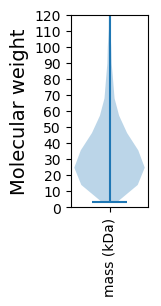
Molecular weight: 6.57 kDa
Isoelectric point according different methods:
Protein with the highest isoelectric point:
>tr|A0A660LC04|A0A660LC04_9ACTN Bcr/CflA family efflux transporter OS=Solirubrobacter pauli OX=166793 GN=C8N24_0375 PE=3 SV=1
MM1 pKa = 6.99QRR3 pKa = 11.84QPAAKK8 pKa = 8.99KK9 pKa = 9.32PAMKK13 pKa = 10.34RR14 pKa = 11.84PLLPPKK20 pKa = 10.02RR21 pKa = 11.84APRR24 pKa = 11.84PALKK28 pKa = 10.19PIARR32 pKa = 11.84QMPKK36 pKa = 8.57QQHH39 pKa = 5.38RR40 pKa = 11.84GGRR43 pKa = 3.54
MM1 pKa = 6.99QRR3 pKa = 11.84QPAAKK8 pKa = 8.99KK9 pKa = 9.32PAMKK13 pKa = 10.34RR14 pKa = 11.84PLLPPKK20 pKa = 10.02RR21 pKa = 11.84APRR24 pKa = 11.84PALKK28 pKa = 10.19PIARR32 pKa = 11.84QMPKK36 pKa = 8.57QQHH39 pKa = 5.38RR40 pKa = 11.84GGRR43 pKa = 3.54
Molecular weight: 4.92 kDa
Isoelectric point according different methods:
Peptides (in silico digests for buttom-up proteomics)
Below you can find in silico digests of the whole proteome with Trypsin, Chymotrypsin, Trypsin+LysC, LysN, ArgC proteases suitable for different mass spec machines.| Try ESI |
 |
|---|
| ChTry ESI |
|
|---|
| ArgC ESI |
|
|---|
| LysN ESI |
|
|---|
| TryLysC ESI |
|
|---|
| Try MALDI |
|
|---|
| ChTry MALDI |
|
|---|
| ArgC MALDI |
|
|---|
| LysN MALDI |
|
|---|
| TryLysC MALDI |
|
|---|
| Try LTQ |
|
|---|
| ChTry LTQ |
|
|---|
| ArgC LTQ |
|
|---|
| LysN LTQ |
|
|---|
| TryLysC LTQ |
|
|---|
| Try MSlow |
|
|---|
| ChTry MSlow |
|
|---|
| ArgC MSlow |
|
|---|
| LysN MSlow |
|
|---|
| TryLysC MSlow |
|
|---|
| Try MShigh |
|
|---|
| ChTry MShigh |
|
|---|
| ArgC MShigh |
|
|---|
| LysN MShigh |
|
|---|
| TryLysC MShigh |
|
|---|
General Statistics
Number of major isoforms |
Number of additional isoforms |
Number of all proteins |
Number of amino acids |
Min. Seq. Length |
Max. Seq. Length |
Avg. Seq. Length |
Avg. Mol. Weight |
|---|---|---|---|---|---|---|---|
0 |
2231201 |
29 |
10614 |
338.6 |
36.16 |
Amino acid frequency
Ala |
Cys |
Asp |
Glu |
Phe |
Gly |
His |
Ile |
Lys |
Leu |
|---|---|---|---|---|---|---|---|---|---|
14.17 ± 0.051 | 0.727 ± 0.009 |
6.056 ± 0.024 | 5.816 ± 0.04 |
2.987 ± 0.017 | 9.207 ± 0.044 |
2.02 ± 0.016 | 3.704 ± 0.022 |
2.255 ± 0.026 | 10.224 ± 0.042 |
Met |
Asn |
Gln |
Pro |
Arg |
Ser |
Thr |
Val |
Trp |
Tyr |
|---|---|---|---|---|---|---|---|---|---|
1.599 ± 0.014 | 1.971 ± 0.025 |
5.771 ± 0.03 | 2.693 ± 0.016 |
7.824 ± 0.047 | 4.945 ± 0.026 |
6.189 ± 0.049 | 8.519 ± 0.026 |
1.369 ± 0.013 | 1.954 ± 0.017 |
Most of the basic statistics you can see at this page can be downloaded from this CSV file
See this proteome in:

Proteome-pI is available under Creative Commons Attribution-NoDerivs license, for more details see here
| Reference: Kozlowski LP. Proteome-pI 2.0: Proteome Isoelectric Point Database Update. Nucleic Acids Res. 2021, doi: 10.1093/nar/gkab944 | Contact: Lukasz P. Kozlowski |