Leifsonia sp. BK543
Taxonomy: cellular organisms; Bacteria; Terrabacteria group; Actinobacteria; Actinomycetia; Micrococcales; Microbacteriaceae; Leifsonia; unclassified Leifsonia
Average proteome isoelectric point is 5.9
Get precalculated fractions of proteins
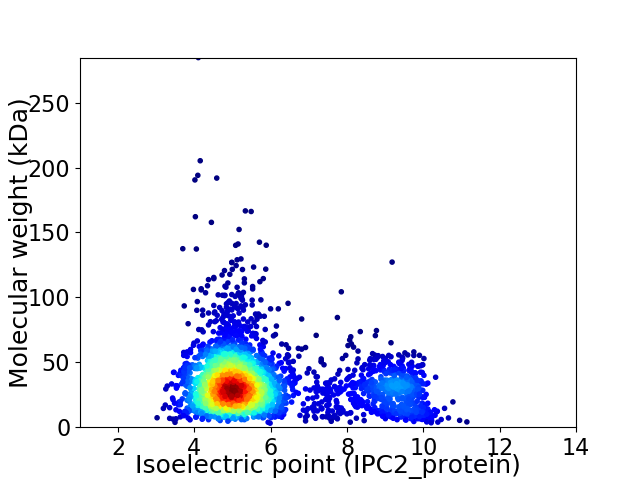
Virtual 2D-PAGE plot for 3055 proteins (isoelectric point calculated using IPC2_protein)
Get csv file with sequences according to given criteria:
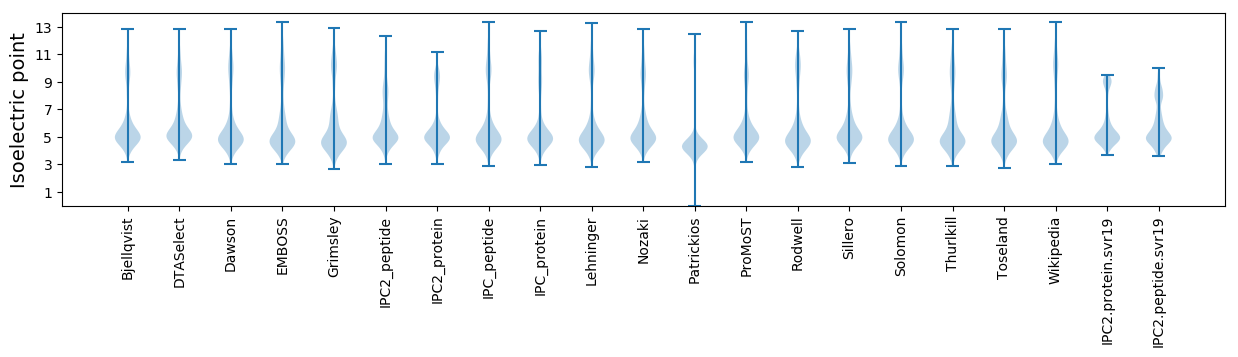
* You can choose from 21 different methods for calculating isoelectric point
Summary statistics related to proteome-wise predictions
Protein with the lowest isoelectric point:
>tr|A0A4Q7PR06|A0A4Q7PR06_9MICO 6 7-dimethyl-8-ribityllumazine synthase OS=Leifsonia sp. BK543 OX=2512174 GN=ribH PE=3 SV=1
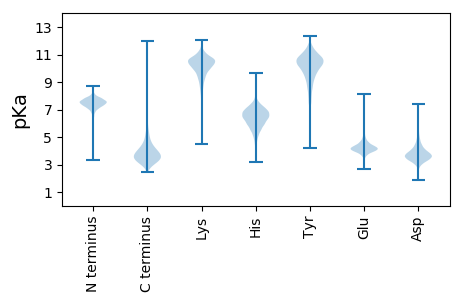
MM1 pKa = 7.59PRR3 pKa = 11.84TRR5 pKa = 11.84HH6 pKa = 5.45RR7 pKa = 11.84RR8 pKa = 11.84TVLLVLLGAAAFALAGCAADD28 pKa = 3.8PEE30 pKa = 4.89VVEE33 pKa = 4.79SAPSASPTPTEE44 pKa = 4.11APAPTSVRR52 pKa = 11.84PDD54 pKa = 2.83ARR56 pKa = 11.84IALTCDD62 pKa = 3.1QLVPTAAADD71 pKa = 3.96GFGAPALHH79 pKa = 6.37GVVDD83 pKa = 5.26LDD85 pKa = 4.04SAAPAQAGWTWCSWGAVGQLRR106 pKa = 11.84LEE108 pKa = 4.29LVVVPDD114 pKa = 4.24GPIDD118 pKa = 4.02DD119 pKa = 4.94SVNEE123 pKa = 4.07PCVLFPSGAGCTAQVSVGSTQVWVTAGYY151 pKa = 9.41PGGTPLADD159 pKa = 3.9ADD161 pKa = 3.61QSFPHH166 pKa = 7.37IVEE169 pKa = 3.93NVAAILAEE177 pKa = 4.34TTVAPAITPQRR188 pKa = 11.84TVPAGAVSGLDD199 pKa = 3.44PATAAGWFGVDD210 pKa = 3.47PDD212 pKa = 3.91GGIPLGVPQEE222 pKa = 4.21ILGDD226 pKa = 3.37AAYY229 pKa = 9.96RR230 pKa = 11.84QTASEE235 pKa = 3.98TAAWGTEE242 pKa = 3.89EE243 pKa = 4.71LSWVQVDD250 pKa = 4.64LLPGGGWAAAGFPDD264 pKa = 5.22APVAPLQQPSAFEE277 pKa = 3.96PTEE280 pKa = 3.96VPGFADD286 pKa = 3.59AALEE290 pKa = 4.16TSDD293 pKa = 6.07GYY295 pKa = 10.78QQLCGAIGTDD305 pKa = 4.16LVCVAAYY312 pKa = 9.88GVDD315 pKa = 3.38PALFLQGAAALAAEE329 pKa = 4.9LGG331 pKa = 3.79
MM1 pKa = 7.59PRR3 pKa = 11.84TRR5 pKa = 11.84HH6 pKa = 5.45RR7 pKa = 11.84RR8 pKa = 11.84TVLLVLLGAAAFALAGCAADD28 pKa = 3.8PEE30 pKa = 4.89VVEE33 pKa = 4.79SAPSASPTPTEE44 pKa = 4.11APAPTSVRR52 pKa = 11.84PDD54 pKa = 2.83ARR56 pKa = 11.84IALTCDD62 pKa = 3.1QLVPTAAADD71 pKa = 3.96GFGAPALHH79 pKa = 6.37GVVDD83 pKa = 5.26LDD85 pKa = 4.04SAAPAQAGWTWCSWGAVGQLRR106 pKa = 11.84LEE108 pKa = 4.29LVVVPDD114 pKa = 4.24GPIDD118 pKa = 4.02DD119 pKa = 4.94SVNEE123 pKa = 4.07PCVLFPSGAGCTAQVSVGSTQVWVTAGYY151 pKa = 9.41PGGTPLADD159 pKa = 3.9ADD161 pKa = 3.61QSFPHH166 pKa = 7.37IVEE169 pKa = 3.93NVAAILAEE177 pKa = 4.34TTVAPAITPQRR188 pKa = 11.84TVPAGAVSGLDD199 pKa = 3.44PATAAGWFGVDD210 pKa = 3.47PDD212 pKa = 3.91GGIPLGVPQEE222 pKa = 4.21ILGDD226 pKa = 3.37AAYY229 pKa = 9.96RR230 pKa = 11.84QTASEE235 pKa = 3.98TAAWGTEE242 pKa = 3.89EE243 pKa = 4.71LSWVQVDD250 pKa = 4.64LLPGGGWAAAGFPDD264 pKa = 5.22APVAPLQQPSAFEE277 pKa = 3.96PTEE280 pKa = 3.96VPGFADD286 pKa = 3.59AALEE290 pKa = 4.16TSDD293 pKa = 6.07GYY295 pKa = 10.78QQLCGAIGTDD305 pKa = 4.16LVCVAAYY312 pKa = 9.88GVDD315 pKa = 3.38PALFLQGAAALAAEE329 pKa = 4.9LGG331 pKa = 3.79
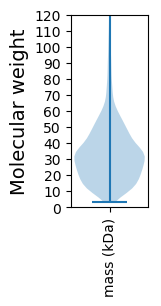
Molecular weight: 33.27 kDa
Isoelectric point according different methods:
Protein with the highest isoelectric point:
>tr|A0A4Q7PRJ4|A0A4Q7PRJ4_9MICO 1-acyl-sn-glycerol-3-phosphate acyltransferase OS=Leifsonia sp. BK543 OX=2512174 GN=EV591_1843 PE=4 SV=1
MM1 pKa = 7.4GSVIKK6 pKa = 10.42KK7 pKa = 8.47RR8 pKa = 11.84RR9 pKa = 11.84KK10 pKa = 9.22RR11 pKa = 11.84MAKK14 pKa = 9.41KK15 pKa = 9.87KK16 pKa = 9.7HH17 pKa = 5.84RR18 pKa = 11.84KK19 pKa = 8.56LLRR22 pKa = 11.84KK23 pKa = 7.78TRR25 pKa = 11.84HH26 pKa = 3.65QRR28 pKa = 11.84RR29 pKa = 11.84NKK31 pKa = 9.78KK32 pKa = 9.85
MM1 pKa = 7.4GSVIKK6 pKa = 10.42KK7 pKa = 8.47RR8 pKa = 11.84RR9 pKa = 11.84KK10 pKa = 9.22RR11 pKa = 11.84MAKK14 pKa = 9.41KK15 pKa = 9.87KK16 pKa = 9.7HH17 pKa = 5.84RR18 pKa = 11.84KK19 pKa = 8.56LLRR22 pKa = 11.84KK23 pKa = 7.78TRR25 pKa = 11.84HH26 pKa = 3.65QRR28 pKa = 11.84RR29 pKa = 11.84NKK31 pKa = 9.78KK32 pKa = 9.85
Molecular weight: 4.08 kDa
Isoelectric point according different methods:
Peptides (in silico digests for buttom-up proteomics)
Below you can find in silico digests of the whole proteome with Trypsin, Chymotrypsin, Trypsin+LysC, LysN, ArgC proteases suitable for different mass spec machines.| Try ESI |
 |
|---|
| ChTry ESI |
|
|---|
| ArgC ESI |
|
|---|
| LysN ESI |
|
|---|
| TryLysC ESI |
|
|---|
| Try MALDI |
|
|---|
| ChTry MALDI |
|
|---|
| ArgC MALDI |
|
|---|
| LysN MALDI |
|
|---|
| TryLysC MALDI |
|
|---|
| Try LTQ |
|
|---|
| ChTry LTQ |
|
|---|
| ArgC LTQ |
|
|---|
| LysN LTQ |
|
|---|
| TryLysC LTQ |
|
|---|
| Try MSlow |
|
|---|
| ChTry MSlow |
|
|---|
| ArgC MSlow |
|
|---|
| LysN MSlow |
|
|---|
| TryLysC MSlow |
|
|---|
| Try MShigh |
|
|---|
| ChTry MShigh |
|
|---|
| ArgC MShigh |
|
|---|
| LysN MShigh |
|
|---|
| TryLysC MShigh |
|
|---|
General Statistics
Number of major isoforms |
Number of additional isoforms |
Number of all proteins |
Number of amino acids |
Min. Seq. Length |
Max. Seq. Length |
Avg. Seq. Length |
Avg. Mol. Weight |
|---|---|---|---|---|---|---|---|
0 |
1003576 |
29 |
2789 |
328.5 |
35.05 |
Amino acid frequency
Ala |
Cys |
Asp |
Glu |
Phe |
Gly |
His |
Ile |
Lys |
Leu |
|---|---|---|---|---|---|---|---|---|---|
13.74 ± 0.065 | 0.445 ± 0.01 |
6.283 ± 0.037 | 5.569 ± 0.044 |
3.199 ± 0.027 | 9.092 ± 0.04 |
1.842 ± 0.021 | 4.599 ± 0.033 |
1.817 ± 0.031 | 10.293 ± 0.048 |
Met |
Asn |
Gln |
Pro |
Arg |
Ser |
Thr |
Val |
Trp |
Tyr |
|---|---|---|---|---|---|---|---|---|---|
1.631 ± 0.016 | 1.901 ± 0.024 |
5.563 ± 0.036 | 2.635 ± 0.024 |
7.123 ± 0.047 | 5.412 ± 0.034 |
6.093 ± 0.055 | 9.191 ± 0.037 |
1.557 ± 0.021 | 2.015 ± 0.021 |
Most of the basic statistics you can see at this page can be downloaded from this CSV file
See this proteome in:

Proteome-pI is available under Creative Commons Attribution-NoDerivs license, for more details see here
| Reference: Kozlowski LP. Proteome-pI 2.0: Proteome Isoelectric Point Database Update. Nucleic Acids Res. 2021, doi: 10.1093/nar/gkab944 | Contact: Lukasz P. Kozlowski |