Aspergillus terreus (strain NIH 2624 / FGSC A1156)
Taxonomy: cellular organisms; Eukaryota; Opisthokonta; Fungi; Dikarya; Ascomycota; saccharomyceta; Pezizomycotina; leotiomyceta; Eurotiomycetes; Eurotiomycetidae; Eurotiales; Aspergillaceae; Aspergillus; Aspergillus subgen. Circumdati; Aspergillus terreus
Average proteome isoelectric point is 6.39
Get precalculated fractions of proteins

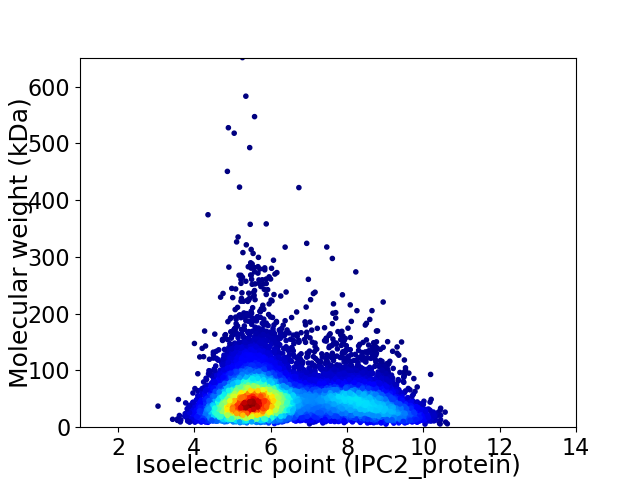
Virtual 2D-PAGE plot for 10417 proteins (isoelectric point calculated using IPC2_protein)
Get csv file with sequences according to given criteria:
* You can choose from 21 different methods for calculating isoelectric point
Summary statistics related to proteome-wise predictions


Protein with the lowest isoelectric point:
>tr|Q0CTY6|Q0CTY6_ASPTN [RNA-polymerase]-subunit kinase OS=Aspergillus terreus (strain NIH 2624 / FGSC A1156) OX=341663 GN=ATEG_02848 PE=3 SV=1
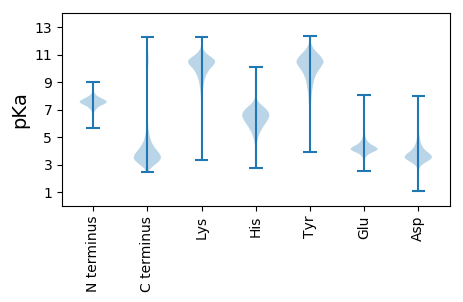
MM1 pKa = 7.05QFSKK5 pKa = 11.22SFMLLAALTTGALALPQKK23 pKa = 10.3RR24 pKa = 11.84DD25 pKa = 2.89WNTAGFGASTASSGSDD41 pKa = 2.92VTYY44 pKa = 10.33QGNVGNPWGSNIIEE58 pKa = 4.25VSSSDD63 pKa = 3.26AASYY67 pKa = 10.71KK68 pKa = 9.27YY69 pKa = 8.98TLEE72 pKa = 3.67ITGQNSEE79 pKa = 3.64PWQIVFWNKK88 pKa = 10.14YY89 pKa = 9.75GPDD92 pKa = 3.42GLMDD96 pKa = 3.71GWFGNSALTLTLNAGEE112 pKa = 4.29TKK114 pKa = 10.57YY115 pKa = 11.01VAFDD119 pKa = 4.29DD120 pKa = 4.08DD121 pKa = 4.51TNGGFAAGPGSVPTANGEE139 pKa = 4.09WASTWGEE146 pKa = 3.81FDD148 pKa = 4.98FGSTTNGGWSGFDD161 pKa = 2.97VSAIVAQNTGQTVQGMQMCDD181 pKa = 3.09KK182 pKa = 11.01ASGVCSTITPNAATVDD198 pKa = 3.73NAYY201 pKa = 6.81TTAEE205 pKa = 4.04TDD207 pKa = 2.75IGGIGGNISGGGQVQLTAVIDD228 pKa = 3.96YY229 pKa = 10.66QGG231 pKa = 2.91
MM1 pKa = 7.05QFSKK5 pKa = 11.22SFMLLAALTTGALALPQKK23 pKa = 10.3RR24 pKa = 11.84DD25 pKa = 2.89WNTAGFGASTASSGSDD41 pKa = 2.92VTYY44 pKa = 10.33QGNVGNPWGSNIIEE58 pKa = 4.25VSSSDD63 pKa = 3.26AASYY67 pKa = 10.71KK68 pKa = 9.27YY69 pKa = 8.98TLEE72 pKa = 3.67ITGQNSEE79 pKa = 3.64PWQIVFWNKK88 pKa = 10.14YY89 pKa = 9.75GPDD92 pKa = 3.42GLMDD96 pKa = 3.71GWFGNSALTLTLNAGEE112 pKa = 4.29TKK114 pKa = 10.57YY115 pKa = 11.01VAFDD119 pKa = 4.29DD120 pKa = 4.08DD121 pKa = 4.51TNGGFAAGPGSVPTANGEE139 pKa = 4.09WASTWGEE146 pKa = 3.81FDD148 pKa = 4.98FGSTTNGGWSGFDD161 pKa = 2.97VSAIVAQNTGQTVQGMQMCDD181 pKa = 3.09KK182 pKa = 11.01ASGVCSTITPNAATVDD198 pKa = 3.73NAYY201 pKa = 6.81TTAEE205 pKa = 4.04TDD207 pKa = 2.75IGGIGGNISGGGQVQLTAVIDD228 pKa = 3.96YY229 pKa = 10.66QGG231 pKa = 2.91
Molecular weight: 23.92 kDa
Isoelectric point according different methods:
Protein with the highest isoelectric point:
>tr|Q0CN60|Q0CN60_ASPTN GTP-binding protein ypt3 OS=Aspergillus terreus (strain NIH 2624 / FGSC A1156) OX=341663 GN=ATEG_04874 PE=4 SV=1
MM1 pKa = 7.38LTTTASSRR9 pKa = 11.84KK10 pKa = 8.93RR11 pKa = 11.84RR12 pKa = 11.84TISRR16 pKa = 11.84TASTTNNLLSGYY28 pKa = 9.66RR29 pKa = 11.84PFISAVPSSEE39 pKa = 3.96STSNSLVPGGQSGSTAHH56 pKa = 7.02ACTSLTTTTRR66 pKa = 11.84RR67 pKa = 11.84GLRR70 pKa = 11.84ARR72 pKa = 11.84GCACADD78 pKa = 3.25ARR80 pKa = 11.84SVGSTSSPSSTVLSTFTVSVRR101 pKa = 11.84SYY103 pKa = 9.6PSAVAKK109 pKa = 9.44TVVAIAAFATTASSLGSCAARR130 pKa = 11.84AAKK133 pKa = 10.2ACTEE137 pKa = 3.99AKK139 pKa = 10.08EE140 pKa = 4.23EE141 pKa = 4.13RR142 pKa = 11.84SSGQTSQMPGRR153 pKa = 11.84PVEE156 pKa = 3.86VSMEE160 pKa = 3.75VRR162 pKa = 11.84AASPAEE168 pKa = 3.74RR169 pKa = 11.84GMEE172 pKa = 4.05VVVVMDD178 pKa = 4.03RR179 pKa = 11.84VV180 pKa = 3.23
MM1 pKa = 7.38LTTTASSRR9 pKa = 11.84KK10 pKa = 8.93RR11 pKa = 11.84RR12 pKa = 11.84TISRR16 pKa = 11.84TASTTNNLLSGYY28 pKa = 9.66RR29 pKa = 11.84PFISAVPSSEE39 pKa = 3.96STSNSLVPGGQSGSTAHH56 pKa = 7.02ACTSLTTTTRR66 pKa = 11.84RR67 pKa = 11.84GLRR70 pKa = 11.84ARR72 pKa = 11.84GCACADD78 pKa = 3.25ARR80 pKa = 11.84SVGSTSSPSSTVLSTFTVSVRR101 pKa = 11.84SYY103 pKa = 9.6PSAVAKK109 pKa = 9.44TVVAIAAFATTASSLGSCAARR130 pKa = 11.84AAKK133 pKa = 10.2ACTEE137 pKa = 3.99AKK139 pKa = 10.08EE140 pKa = 4.23EE141 pKa = 4.13RR142 pKa = 11.84SSGQTSQMPGRR153 pKa = 11.84PVEE156 pKa = 3.86VSMEE160 pKa = 3.75VRR162 pKa = 11.84AASPAEE168 pKa = 3.74RR169 pKa = 11.84GMEE172 pKa = 4.05VVVVMDD178 pKa = 4.03RR179 pKa = 11.84VV180 pKa = 3.23
Molecular weight: 18.48 kDa
Isoelectric point according different methods:
Peptides (in silico digests for buttom-up proteomics)
Below you can find in silico digests of the whole proteome with Trypsin, Chymotrypsin, Trypsin+LysC, LysN, ArgC proteases suitable for different mass spec machines.| Try ESI |
 |
|---|
| ChTry ESI |
 |
|---|
| ArgC ESI |
 |
|---|
| LysN ESI |
 |
|---|
| TryLysC ESI |
 |
|---|
| Try MALDI |
 |
|---|
| ChTry MALDI |
 |
|---|
| ArgC MALDI |
 |
|---|
| LysN MALDI |
 |
|---|
| TryLysC MALDI |
 |
|---|
| Try LTQ |
 |
|---|
| ChTry LTQ |
 |
|---|
| ArgC LTQ |
 |
|---|
| LysN LTQ |
 |
|---|
| TryLysC LTQ |
 |
|---|
| Try MSlow |
 |
|---|
| ChTry MSlow |
 |
|---|
| ArgC MSlow |
 |
|---|
| LysN MSlow |
 |
|---|
| TryLysC MSlow |
 |
|---|
| Try MShigh |
 |
|---|
| ChTry MShigh |
 |
|---|
| ArgC MShigh |
 |
|---|
| LysN MShigh |
 |
|---|
| TryLysC MShigh |
 |
|---|
General Statistics
Number of major isoforms |
Number of additional isoforms |
Number of all proteins |
Number of amino acids |
Min. Seq. Length |
Max. Seq. Length |
Avg. Seq. Length |
Avg. Mol. Weight |
|---|---|---|---|---|---|---|---|
0 |
5198365 |
48 |
5842 |
499.0 |
55.25 |
Amino acid frequency
Ala |
Cys |
Asp |
Glu |
Phe |
Gly |
His |
Ile |
Lys |
Leu |
|---|---|---|---|---|---|---|---|---|---|
8.738 ± 0.023 | 1.292 ± 0.009 |
5.726 ± 0.018 | 6.024 ± 0.026 |
3.741 ± 0.015 | 6.855 ± 0.024 |
2.477 ± 0.01 | 4.821 ± 0.016 |
4.414 ± 0.021 | 9.119 ± 0.025 |
Met |
Asn |
Gln |
Pro |
Arg |
Ser |
Thr |
Val |
Trp |
Tyr |
|---|---|---|---|---|---|---|---|---|---|
2.182 ± 0.008 | 3.486 ± 0.012 |
6.158 ± 0.026 | 3.969 ± 0.016 |
6.295 ± 0.02 | 8.105 ± 0.025 |
5.889 ± 0.015 | 6.326 ± 0.017 |
1.499 ± 0.008 | 2.884 ± 0.014 |
Most of the basic statistics you can see at this page can be downloaded from this CSV file
Proteome-pI is available under Creative Commons Attribution-NoDerivs license, for more details see here
| Reference: Kozlowski LP. Proteome-pI 2.0: Proteome Isoelectric Point Database Update. Nucleic Acids Res. 2021, doi: 10.1093/nar/gkab944 | Contact: Lukasz P. Kozlowski |
