Spiroplasma syrphidicola EA-1
Taxonomy: cellular organisms; Bacteria; Terrabacteria group; Tenericutes; Mollicutes; Entomoplasmatales; Spiroplasmataceae; Spiroplasma; Spiroplasma syrphidicola
Average proteome isoelectric point is 7.0
Get precalculated fractions of proteins

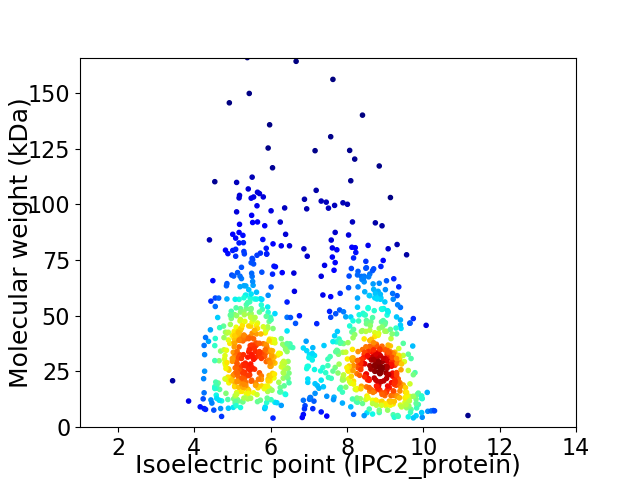
Virtual 2D-PAGE plot for 1006 proteins (isoelectric point calculated using IPC2_protein)
Get csv file with sequences according to given criteria:
* You can choose from 21 different methods for calculating isoelectric point
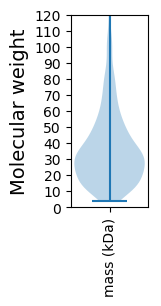
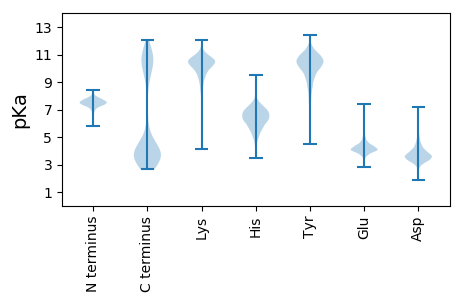
Summary statistics related to proteome-wise predictions


Protein with the lowest isoelectric point:
>tr|R4U5P1|R4U5P1_9MOLU Dipeptidase PepV OS=Spiroplasma syrphidicola EA-1 OX=1276229 GN=ytjP PE=4 SV=1
MM1 pKa = 7.45NNGFYY6 pKa = 10.39ILPNDD11 pKa = 3.12EE12 pKa = 4.53GYY14 pKa = 10.66LVKK17 pKa = 10.77SHH19 pKa = 6.83DD20 pKa = 3.97TNGDD24 pKa = 3.11VALFRR29 pKa = 11.84SRR31 pKa = 11.84RR32 pKa = 11.84DD33 pKa = 3.15AEE35 pKa = 4.33VFISALTTPQHH46 pKa = 5.25GMGYY50 pKa = 8.24QAPYY54 pKa = 8.62PGYY57 pKa = 9.96MPGQPMMPMYY67 pKa = 9.91PPQSSPQVFFIQQPAAPSPYY87 pKa = 9.46PPAPYY92 pKa = 9.55PFYY95 pKa = 11.02NSYY98 pKa = 9.32PAPGMMVPPMPMPGCGCQHH117 pKa = 6.42GFDD120 pKa = 4.46HH121 pKa = 6.37QHH123 pKa = 5.07QAGNNVNNGNNQNNRR138 pKa = 11.84QGQGNFDD145 pKa = 3.66NNVNNNANQNDD156 pKa = 4.24YY157 pKa = 11.37NLNQPPYY164 pKa = 9.32YY165 pKa = 9.19EE166 pKa = 4.19QEE168 pKa = 4.03FMADD172 pKa = 3.58PVYY175 pKa = 10.74LGQDD179 pKa = 3.04QNYY182 pKa = 8.93DD183 pKa = 3.12QNYY186 pKa = 9.48NYY188 pKa = 10.55NNEE191 pKa = 4.12ANYY194 pKa = 10.77SQTDD198 pKa = 3.64NNGTDD203 pKa = 3.62YY204 pKa = 11.71NDD206 pKa = 4.76GNNQTQDD213 pKa = 3.18NEE215 pKa = 4.19YY216 pKa = 10.44SQPEE220 pKa = 4.3GQAEE224 pKa = 3.99DD225 pKa = 3.68TNINNFGQEE234 pKa = 3.5NSQYY238 pKa = 10.88QEE240 pKa = 3.96TANQDD245 pKa = 3.38NNFEE249 pKa = 4.46NIIGDD254 pKa = 3.89SGDD257 pKa = 3.37MFDD260 pKa = 6.3FIDD263 pKa = 4.08NEE265 pKa = 4.43PVSSEE270 pKa = 3.8SGEE273 pKa = 3.92LSKK276 pKa = 11.11RR277 pKa = 11.84QLKK280 pKa = 10.22KK281 pKa = 10.26LAKK284 pKa = 9.29QEE286 pKa = 3.84KK287 pKa = 9.53KK288 pKa = 10.14AAKK291 pKa = 9.08IQNKK295 pKa = 8.99VEE297 pKa = 3.96QKK299 pKa = 9.85NAKK302 pKa = 9.65KK303 pKa = 9.03MAKK306 pKa = 9.49LGKK309 pKa = 9.66YY310 pKa = 8.94DD311 pKa = 3.71QYY313 pKa = 12.19DD314 pKa = 3.53NLEE317 pKa = 4.54DD318 pKa = 4.04LDD320 pKa = 4.54SFVEE324 pKa = 4.2
MM1 pKa = 7.45NNGFYY6 pKa = 10.39ILPNDD11 pKa = 3.12EE12 pKa = 4.53GYY14 pKa = 10.66LVKK17 pKa = 10.77SHH19 pKa = 6.83DD20 pKa = 3.97TNGDD24 pKa = 3.11VALFRR29 pKa = 11.84SRR31 pKa = 11.84RR32 pKa = 11.84DD33 pKa = 3.15AEE35 pKa = 4.33VFISALTTPQHH46 pKa = 5.25GMGYY50 pKa = 8.24QAPYY54 pKa = 8.62PGYY57 pKa = 9.96MPGQPMMPMYY67 pKa = 9.91PPQSSPQVFFIQQPAAPSPYY87 pKa = 9.46PPAPYY92 pKa = 9.55PFYY95 pKa = 11.02NSYY98 pKa = 9.32PAPGMMVPPMPMPGCGCQHH117 pKa = 6.42GFDD120 pKa = 4.46HH121 pKa = 6.37QHH123 pKa = 5.07QAGNNVNNGNNQNNRR138 pKa = 11.84QGQGNFDD145 pKa = 3.66NNVNNNANQNDD156 pKa = 4.24YY157 pKa = 11.37NLNQPPYY164 pKa = 9.32YY165 pKa = 9.19EE166 pKa = 4.19QEE168 pKa = 4.03FMADD172 pKa = 3.58PVYY175 pKa = 10.74LGQDD179 pKa = 3.04QNYY182 pKa = 8.93DD183 pKa = 3.12QNYY186 pKa = 9.48NYY188 pKa = 10.55NNEE191 pKa = 4.12ANYY194 pKa = 10.77SQTDD198 pKa = 3.64NNGTDD203 pKa = 3.62YY204 pKa = 11.71NDD206 pKa = 4.76GNNQTQDD213 pKa = 3.18NEE215 pKa = 4.19YY216 pKa = 10.44SQPEE220 pKa = 4.3GQAEE224 pKa = 3.99DD225 pKa = 3.68TNINNFGQEE234 pKa = 3.5NSQYY238 pKa = 10.88QEE240 pKa = 3.96TANQDD245 pKa = 3.38NNFEE249 pKa = 4.46NIIGDD254 pKa = 3.89SGDD257 pKa = 3.37MFDD260 pKa = 6.3FIDD263 pKa = 4.08NEE265 pKa = 4.43PVSSEE270 pKa = 3.8SGEE273 pKa = 3.92LSKK276 pKa = 11.11RR277 pKa = 11.84QLKK280 pKa = 10.22KK281 pKa = 10.26LAKK284 pKa = 9.29QEE286 pKa = 3.84KK287 pKa = 9.53KK288 pKa = 10.14AAKK291 pKa = 9.08IQNKK295 pKa = 8.99VEE297 pKa = 3.96QKK299 pKa = 9.85NAKK302 pKa = 9.65KK303 pKa = 9.03MAKK306 pKa = 9.49LGKK309 pKa = 9.66YY310 pKa = 8.94DD311 pKa = 3.71QYY313 pKa = 12.19DD314 pKa = 3.53NLEE317 pKa = 4.54DD318 pKa = 4.04LDD320 pKa = 4.54SFVEE324 pKa = 4.2
Molecular weight: 36.68 kDa
Isoelectric point according different methods:
Protein with the highest isoelectric point:
>tr|R4U2R2|R4U2R2_9MOLU Uncharacterized protein OS=Spiroplasma syrphidicola EA-1 OX=1276229 GN=SSYRP_v1c00510 PE=4 SV=1
MM1 pKa = 7.32KK2 pKa = 9.47RR3 pKa = 11.84TWQPSKK9 pKa = 10.14IKK11 pKa = 10.33HH12 pKa = 5.53KK13 pKa = 9.07RR14 pKa = 11.84THH16 pKa = 5.84GFRR19 pKa = 11.84ARR21 pKa = 11.84MQSATGRR28 pKa = 11.84KK29 pKa = 8.39LLSRR33 pKa = 11.84RR34 pKa = 11.84RR35 pKa = 11.84LKK37 pKa = 10.5GRR39 pKa = 11.84KK40 pKa = 8.78VLSAA44 pKa = 4.05
MM1 pKa = 7.32KK2 pKa = 9.47RR3 pKa = 11.84TWQPSKK9 pKa = 10.14IKK11 pKa = 10.33HH12 pKa = 5.53KK13 pKa = 9.07RR14 pKa = 11.84THH16 pKa = 5.84GFRR19 pKa = 11.84ARR21 pKa = 11.84MQSATGRR28 pKa = 11.84KK29 pKa = 8.39LLSRR33 pKa = 11.84RR34 pKa = 11.84RR35 pKa = 11.84LKK37 pKa = 10.5GRR39 pKa = 11.84KK40 pKa = 8.78VLSAA44 pKa = 4.05
Molecular weight: 5.25 kDa
Isoelectric point according different methods:
Peptides (in silico digests for buttom-up proteomics)
Below you can find in silico digests of the whole proteome with Trypsin, Chymotrypsin, Trypsin+LysC, LysN, ArgC proteases suitable for different mass spec machines.| Try ESI |
 |
|---|
| ChTry ESI |
 |
|---|
| ArgC ESI |
 |
|---|
| LysN ESI |
 |
|---|
| TryLysC ESI |
 |
|---|
| Try MALDI |
 |
|---|
| ChTry MALDI |
 |
|---|
| ArgC MALDI |
 |
|---|
| LysN MALDI |
 |
|---|
| TryLysC MALDI |
 |
|---|
| Try LTQ |
 |
|---|
| ChTry LTQ |
 |
|---|
| ArgC LTQ |
 |
|---|
| LysN LTQ |
 |
|---|
| TryLysC LTQ |
 |
|---|
| Try MSlow |
 |
|---|
| ChTry MSlow |
 |
|---|
| ArgC MSlow |
 |
|---|
| LysN MSlow |
 |
|---|
| TryLysC MSlow |
 |
|---|
| Try MShigh |
 |
|---|
| ChTry MShigh |
 |
|---|
| ArgC MShigh |
 |
|---|
| LysN MShigh |
 |
|---|
| TryLysC MShigh |
 |
|---|
General Statistics
Number of major isoforms |
Number of additional isoforms |
Number of all proteins |
Number of amino acids |
Min. Seq. Length |
Max. Seq. Length |
Avg. Seq. Length |
Avg. Mol. Weight |
|---|---|---|---|---|---|---|---|
0 |
333167 |
34 |
1451 |
331.2 |
37.69 |
Amino acid frequency
Ala |
Cys |
Asp |
Glu |
Phe |
Gly |
His |
Ile |
Lys |
Leu |
|---|---|---|---|---|---|---|---|---|---|
5.976 ± 0.082 | 0.692 ± 0.02 |
5.089 ± 0.055 | 6.023 ± 0.081 |
5.175 ± 0.066 | 5.398 ± 0.075 |
1.524 ± 0.03 | 9.584 ± 0.078 |
8.533 ± 0.092 | 10.177 ± 0.08 |
Met |
Asn |
Gln |
Pro |
Arg |
Ser |
Thr |
Val |
Trp |
Tyr |
|---|---|---|---|---|---|---|---|---|---|
2.07 ± 0.033 | 7.171 ± 0.087 |
3.083 ± 0.039 | 3.966 ± 0.054 |
2.927 ± 0.04 | 5.615 ± 0.051 |
5.634 ± 0.052 | 6.013 ± 0.055 |
1.135 ± 0.032 | 4.213 ± 0.053 |
Most of the basic statistics you can see at this page can be downloaded from this CSV file
Proteome-pI is available under Creative Commons Attribution-NoDerivs license, for more details see here
| Reference: Kozlowski LP. Proteome-pI 2.0: Proteome Isoelectric Point Database Update. Nucleic Acids Res. 2021, doi: 10.1093/nar/gkab944 | Contact: Lukasz P. Kozlowski |
