Cellulomonas sp. Leaf395
Taxonomy: cellular organisms; Bacteria; Terrabacteria group; Actinobacteria; Actinomycetia; Micrococcales; Cellulomonadaceae; Cellulomonas; unclassified Cellulomonas
Average proteome isoelectric point is 5.9
Get precalculated fractions of proteins

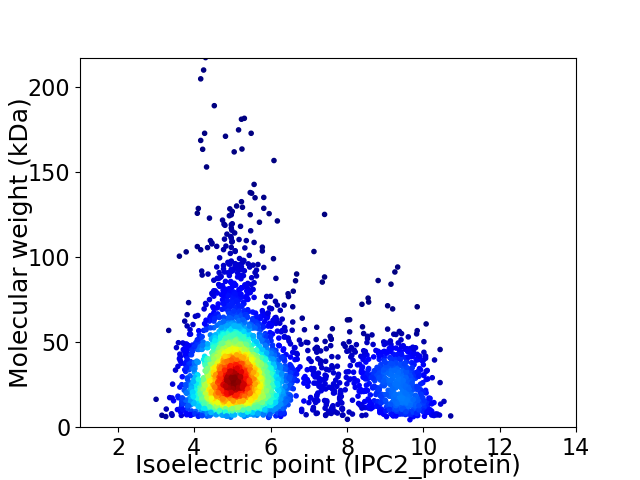
Virtual 2D-PAGE plot for 3738 proteins (isoelectric point calculated using IPC2_protein)
Get csv file with sequences according to given criteria:
* You can choose from 21 different methods for calculating isoelectric point
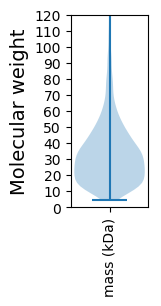
Summary statistics related to proteome-wise predictions


Protein with the lowest isoelectric point:
>tr|A0A0T0MKR7|A0A0T0MKR7_9CELL Uncharacterized protein OS=Cellulomonas sp. Leaf395 OX=1736362 GN=ASG23_06805 PE=4 SV=1
MM1 pKa = 7.49FPAQQSRR8 pKa = 11.84RR9 pKa = 11.84ASTVLATAGLAFASVLVPAAAATAAPAATACDD41 pKa = 3.28SRR43 pKa = 11.84TNNTYY48 pKa = 11.18DD49 pKa = 3.39KK50 pKa = 11.24VLGCVTVDD58 pKa = 3.03GVLEE62 pKa = 4.15HH63 pKa = 7.21EE64 pKa = 4.73EE65 pKa = 4.0AFQAIADD72 pKa = 3.91ANGGNRR78 pKa = 11.84AAGTTGYY85 pKa = 7.12TASVDD90 pKa = 3.87YY91 pKa = 11.12VVEE94 pKa = 4.12TLEE97 pKa = 4.04AAGWSVEE104 pKa = 3.73LDD106 pKa = 3.29EE107 pKa = 6.17FPFTFVPPPLLEE119 pKa = 3.98QLMPTQATYY128 pKa = 9.38STGVFTGTGYY138 pKa = 11.54GEE140 pKa = 4.09VTGNVIPVDD149 pKa = 3.26IVLAPPRR156 pKa = 11.84DD157 pKa = 3.81PVTSGCEE164 pKa = 3.49ASDD167 pKa = 3.79FVGLDD172 pKa = 3.27FSGTADD178 pKa = 2.89IALIQRR184 pKa = 11.84GTCEE188 pKa = 4.2FGVKK192 pKa = 10.28AINAQTAGAEE202 pKa = 3.86AVIIFNQGNTEE213 pKa = 3.97LRR215 pKa = 11.84SGLVTGTLFGINQTPLSIPVVGASFADD242 pKa = 4.38GEE244 pKa = 4.3ALAAAGSTARR254 pKa = 11.84VRR256 pKa = 11.84VDD258 pKa = 3.53LPEE261 pKa = 4.4SRR263 pKa = 11.84PQVNVIAEE271 pKa = 4.18LAGRR275 pKa = 11.84TDD277 pKa = 3.65GNVVMAGAHH286 pKa = 6.37LDD288 pKa = 3.8SVQAGPGINDD298 pKa = 3.47NGSGSSALLEE308 pKa = 4.23VAQQIAKK315 pKa = 9.61VKK317 pKa = 10.31PEE319 pKa = 3.72NTLRR323 pKa = 11.84FAWWGAEE330 pKa = 3.73EE331 pKa = 4.42SGLLGSRR338 pKa = 11.84AYY340 pKa = 10.57VAGLDD345 pKa = 3.65QAGLDD350 pKa = 4.17EE351 pKa = 4.55IALYY355 pKa = 11.25LNFDD359 pKa = 3.93MVASPNYY366 pKa = 9.86IFMVYY371 pKa = 10.42DD372 pKa = 3.72GDD374 pKa = 3.85EE375 pKa = 4.42SGFPAPVVVPEE386 pKa = 4.46GSVQIEE392 pKa = 4.2DD393 pKa = 3.95FFEE396 pKa = 4.05SFYY399 pKa = 10.12TSRR402 pKa = 11.84GIPYY406 pKa = 10.22DD407 pKa = 3.51DD408 pKa = 4.89AEE410 pKa = 4.16FSGRR414 pKa = 11.84SDD416 pKa = 3.35YY417 pKa = 11.02QAFIQNGIPAGGLFTGAEE435 pKa = 4.39VVKK438 pKa = 10.77SPEE441 pKa = 3.66QAAIWGGTAGQQYY454 pKa = 10.41DD455 pKa = 3.78PCYY458 pKa = 10.51HH459 pKa = 7.05LACDD463 pKa = 4.06TIDD466 pKa = 4.29NISLEE471 pKa = 4.17ALDD474 pKa = 4.36VNTDD478 pKa = 4.12AIAAAVLTYY487 pKa = 10.23AYY489 pKa = 9.31STEE492 pKa = 4.21TVNGVVGQQVPGNFVLPAPAGPQGTTGSGGGDD524 pKa = 2.86EE525 pKa = 4.4VDD527 pKa = 3.5GVEE530 pKa = 4.16
MM1 pKa = 7.49FPAQQSRR8 pKa = 11.84RR9 pKa = 11.84ASTVLATAGLAFASVLVPAAAATAAPAATACDD41 pKa = 3.28SRR43 pKa = 11.84TNNTYY48 pKa = 11.18DD49 pKa = 3.39KK50 pKa = 11.24VLGCVTVDD58 pKa = 3.03GVLEE62 pKa = 4.15HH63 pKa = 7.21EE64 pKa = 4.73EE65 pKa = 4.0AFQAIADD72 pKa = 3.91ANGGNRR78 pKa = 11.84AAGTTGYY85 pKa = 7.12TASVDD90 pKa = 3.87YY91 pKa = 11.12VVEE94 pKa = 4.12TLEE97 pKa = 4.04AAGWSVEE104 pKa = 3.73LDD106 pKa = 3.29EE107 pKa = 6.17FPFTFVPPPLLEE119 pKa = 3.98QLMPTQATYY128 pKa = 9.38STGVFTGTGYY138 pKa = 11.54GEE140 pKa = 4.09VTGNVIPVDD149 pKa = 3.26IVLAPPRR156 pKa = 11.84DD157 pKa = 3.81PVTSGCEE164 pKa = 3.49ASDD167 pKa = 3.79FVGLDD172 pKa = 3.27FSGTADD178 pKa = 2.89IALIQRR184 pKa = 11.84GTCEE188 pKa = 4.2FGVKK192 pKa = 10.28AINAQTAGAEE202 pKa = 3.86AVIIFNQGNTEE213 pKa = 3.97LRR215 pKa = 11.84SGLVTGTLFGINQTPLSIPVVGASFADD242 pKa = 4.38GEE244 pKa = 4.3ALAAAGSTARR254 pKa = 11.84VRR256 pKa = 11.84VDD258 pKa = 3.53LPEE261 pKa = 4.4SRR263 pKa = 11.84PQVNVIAEE271 pKa = 4.18LAGRR275 pKa = 11.84TDD277 pKa = 3.65GNVVMAGAHH286 pKa = 6.37LDD288 pKa = 3.8SVQAGPGINDD298 pKa = 3.47NGSGSSALLEE308 pKa = 4.23VAQQIAKK315 pKa = 9.61VKK317 pKa = 10.31PEE319 pKa = 3.72NTLRR323 pKa = 11.84FAWWGAEE330 pKa = 3.73EE331 pKa = 4.42SGLLGSRR338 pKa = 11.84AYY340 pKa = 10.57VAGLDD345 pKa = 3.65QAGLDD350 pKa = 4.17EE351 pKa = 4.55IALYY355 pKa = 11.25LNFDD359 pKa = 3.93MVASPNYY366 pKa = 9.86IFMVYY371 pKa = 10.42DD372 pKa = 3.72GDD374 pKa = 3.85EE375 pKa = 4.42SGFPAPVVVPEE386 pKa = 4.46GSVQIEE392 pKa = 4.2DD393 pKa = 3.95FFEE396 pKa = 4.05SFYY399 pKa = 10.12TSRR402 pKa = 11.84GIPYY406 pKa = 10.22DD407 pKa = 3.51DD408 pKa = 4.89AEE410 pKa = 4.16FSGRR414 pKa = 11.84SDD416 pKa = 3.35YY417 pKa = 11.02QAFIQNGIPAGGLFTGAEE435 pKa = 4.39VVKK438 pKa = 10.77SPEE441 pKa = 3.66QAAIWGGTAGQQYY454 pKa = 10.41DD455 pKa = 3.78PCYY458 pKa = 10.51HH459 pKa = 7.05LACDD463 pKa = 4.06TIDD466 pKa = 4.29NISLEE471 pKa = 4.17ALDD474 pKa = 4.36VNTDD478 pKa = 4.12AIAAAVLTYY487 pKa = 10.23AYY489 pKa = 9.31STEE492 pKa = 4.21TVNGVVGQQVPGNFVLPAPAGPQGTTGSGGGDD524 pKa = 2.86EE525 pKa = 4.4VDD527 pKa = 3.5GVEE530 pKa = 4.16
Molecular weight: 54.72 kDa
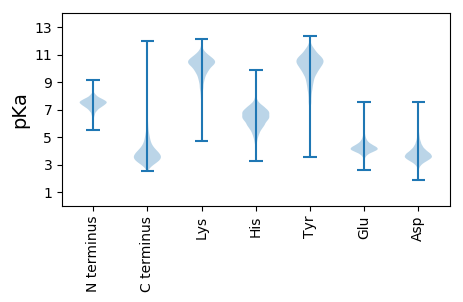
Isoelectric point according different methods:
Protein with the highest isoelectric point:
>tr|A0A0T0MJC2|A0A0T0MJC2_9CELL Peptide-methionine (R)-S-oxide reductase OS=Cellulomonas sp. Leaf395 OX=1736362 GN=ASG23_08190 PE=4 SV=1
MM1 pKa = 7.56AVPKK5 pKa = 10.48RR6 pKa = 11.84KK7 pKa = 9.07MSRR10 pKa = 11.84SNTRR14 pKa = 11.84ARR16 pKa = 11.84RR17 pKa = 11.84SQWKK21 pKa = 6.29TTATTLHH28 pKa = 6.39TCPQCKK34 pKa = 9.28ANKK37 pKa = 8.6MPHH40 pKa = 5.35TACPSCGAYY49 pKa = 9.49KK50 pKa = 10.56GRR52 pKa = 11.84AYY54 pKa = 10.6AEE56 pKa = 3.93AVRR59 pKa = 11.84TEE61 pKa = 4.04FEE63 pKa = 4.11VRR65 pKa = 3.28
MM1 pKa = 7.56AVPKK5 pKa = 10.48RR6 pKa = 11.84KK7 pKa = 9.07MSRR10 pKa = 11.84SNTRR14 pKa = 11.84ARR16 pKa = 11.84RR17 pKa = 11.84SQWKK21 pKa = 6.29TTATTLHH28 pKa = 6.39TCPQCKK34 pKa = 9.28ANKK37 pKa = 8.6MPHH40 pKa = 5.35TACPSCGAYY49 pKa = 9.49KK50 pKa = 10.56GRR52 pKa = 11.84AYY54 pKa = 10.6AEE56 pKa = 3.93AVRR59 pKa = 11.84TEE61 pKa = 4.04FEE63 pKa = 4.11VRR65 pKa = 3.28
Molecular weight: 7.36 kDa
Isoelectric point according different methods:
Peptides (in silico digests for buttom-up proteomics)
Below you can find in silico digests of the whole proteome with Trypsin, Chymotrypsin, Trypsin+LysC, LysN, ArgC proteases suitable for different mass spec machines.| Try ESI |
 |
|---|
| ChTry ESI |
 |
|---|
| ArgC ESI |
 |
|---|
| LysN ESI |
 |
|---|
| TryLysC ESI |
 |
|---|
| Try MALDI |
 |
|---|
| ChTry MALDI |
 |
|---|
| ArgC MALDI |
 |
|---|
| LysN MALDI |
 |
|---|
| TryLysC MALDI |
 |
|---|
| Try LTQ |
 |
|---|
| ChTry LTQ |
 |
|---|
| ArgC LTQ |
 |
|---|
| LysN LTQ |
 |
|---|
| TryLysC LTQ |
 |
|---|
| Try MSlow |
 |
|---|
| ChTry MSlow |
 |
|---|
| ArgC MSlow |
 |
|---|
| LysN MSlow |
 |
|---|
| TryLysC MSlow |
 |
|---|
| Try MShigh |
 |
|---|
| ChTry MShigh |
 |
|---|
| ArgC MShigh |
 |
|---|
| LysN MShigh |
 |
|---|
| TryLysC MShigh |
 |
|---|
General Statistics
Number of major isoforms |
Number of additional isoforms |
Number of all proteins |
Number of amino acids |
Min. Seq. Length |
Max. Seq. Length |
Avg. Seq. Length |
Avg. Mol. Weight |
|---|---|---|---|---|---|---|---|
0 |
1224298 |
37 |
2068 |
327.5 |
34.87 |
Amino acid frequency
Ala |
Cys |
Asp |
Glu |
Phe |
Gly |
His |
Ile |
Lys |
Leu |
|---|---|---|---|---|---|---|---|---|---|
13.741 ± 0.057 | 0.555 ± 0.009 |
6.624 ± 0.035 | 5.265 ± 0.039 |
2.678 ± 0.026 | 9.077 ± 0.033 |
2.136 ± 0.022 | 3.369 ± 0.031 |
1.521 ± 0.023 | 10.441 ± 0.052 |
Met |
Asn |
Gln |
Pro |
Arg |
Ser |
Thr |
Val |
Trp |
Tyr |
|---|---|---|---|---|---|---|---|---|---|
1.595 ± 0.015 | 1.609 ± 0.025 |
5.794 ± 0.029 | 2.748 ± 0.022 |
7.526 ± 0.049 | 5.3 ± 0.03 |
6.489 ± 0.041 | 10.05 ± 0.042 |
1.604 ± 0.018 | 1.879 ± 0.022 |
Most of the basic statistics you can see at this page can be downloaded from this CSV file
Proteome-pI is available under Creative Commons Attribution-NoDerivs license, for more details see here
| Reference: Kozlowski LP. Proteome-pI 2.0: Proteome Isoelectric Point Database Update. Nucleic Acids Res. 2021, doi: 10.1093/nar/gkab944 | Contact: Lukasz P. Kozlowski |
