Pseudozyma antarctica (strain T-34) (Yeast) (Candida antarctica)
Taxonomy: cellular organisms; Eukaryota; Opisthokonta; Fungi; Dikarya; Basidiomycota; Ustilaginomycotina; Ustilaginomycetes; Ustilaginales; Ustilaginaceae; Moesziomyces; Moesziomyces antarcticus
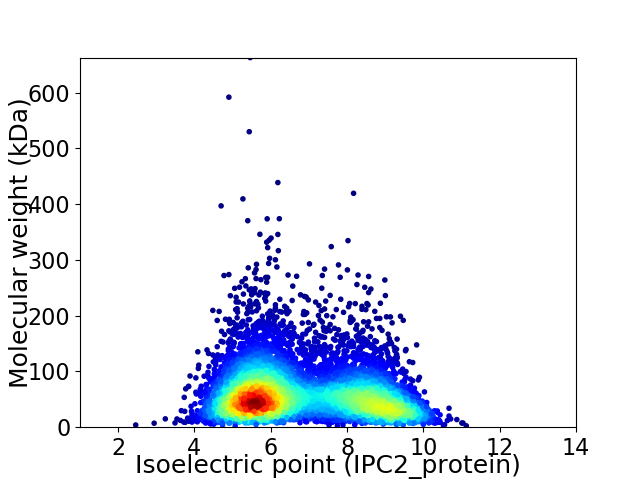
Average proteome isoelectric point is 6.83
Get precalculated fractions of proteins

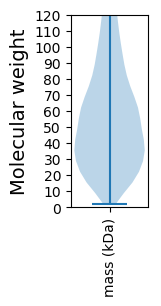
Virtual 2D-PAGE plot for 6640 proteins (isoelectric point calculated using IPC2_protein)
Get csv file with sequences according to given criteria:
* You can choose from 21 different methods for calculating isoelectric point
Summary statistics related to proteome-wise predictions


Protein with the lowest isoelectric point:
>tr|M9LWP5|M9LWP5_PSEA3 Chloride channel protein OS=Pseudozyma antarctica (strain T-34) OX=1151754 GN=PANT_13d00014 PE=3 SV=1
MM1 pKa = 7.62EE2 pKa = 5.05GFINKK7 pKa = 9.47AKK9 pKa = 10.21EE10 pKa = 3.97FAGSDD15 pKa = 3.39QGKK18 pKa = 9.93DD19 pKa = 3.7LINQFSGNKK28 pKa = 9.23NNNNNNSSSGFGGNNNDD45 pKa = 4.32DD46 pKa = 4.42SYY48 pKa = 12.13GSSNNNSSYY57 pKa = 11.21GSSNNNSSYY66 pKa = 11.17GSNDD70 pKa = 2.87NDD72 pKa = 3.7NNNSSSYY79 pKa = 11.0GSSNNNSSSYY89 pKa = 10.88GSNDD93 pKa = 2.88NDD95 pKa = 3.87NNSSSYY101 pKa = 10.75GSSGRR106 pKa = 11.84RR107 pKa = 11.84NNDD110 pKa = 2.93DD111 pKa = 3.79DD112 pKa = 4.3NSYY115 pKa = 11.63GSGNNNSSSYY125 pKa = 10.9GSSGRR130 pKa = 11.84NNDD133 pKa = 3.11NDD135 pKa = 3.28NSYY138 pKa = 11.64GSGNNNSSSYY148 pKa = 11.43GSGNNNLSSYY158 pKa = 11.31GSGNNNSSYY167 pKa = 11.57GNNNDD172 pKa = 3.21NDD174 pKa = 4.58SYY176 pKa = 11.41GSSGRR181 pKa = 11.84GGNNSSSYY189 pKa = 11.01GGNNDD194 pKa = 3.21NDD196 pKa = 4.42SYY198 pKa = 11.83ASSGRR203 pKa = 11.84NNDD206 pKa = 3.13NDD208 pKa = 4.25SYY210 pKa = 11.29GSSGRR215 pKa = 11.84GGNSGGFGSSNDD227 pKa = 3.28NDD229 pKa = 4.41SYY231 pKa = 11.48GSSGRR236 pKa = 11.84GGNSGGYY243 pKa = 9.83GGSNDD248 pKa = 3.34NDD250 pKa = 4.27SYY252 pKa = 11.53GSSGRR257 pKa = 11.84GGSGYY262 pKa = 11.25GNDD265 pKa = 3.78NSDD268 pKa = 4.55SYY270 pKa = 11.96GSSNNNNNDD279 pKa = 3.27YY280 pKa = 11.48
MM1 pKa = 7.62EE2 pKa = 5.05GFINKK7 pKa = 9.47AKK9 pKa = 10.21EE10 pKa = 3.97FAGSDD15 pKa = 3.39QGKK18 pKa = 9.93DD19 pKa = 3.7LINQFSGNKK28 pKa = 9.23NNNNNNSSSGFGGNNNDD45 pKa = 4.32DD46 pKa = 4.42SYY48 pKa = 12.13GSSNNNSSYY57 pKa = 11.21GSSNNNSSYY66 pKa = 11.17GSNDD70 pKa = 2.87NDD72 pKa = 3.7NNNSSSYY79 pKa = 11.0GSSNNNSSSYY89 pKa = 10.88GSNDD93 pKa = 2.88NDD95 pKa = 3.87NNSSSYY101 pKa = 10.75GSSGRR106 pKa = 11.84RR107 pKa = 11.84NNDD110 pKa = 2.93DD111 pKa = 3.79DD112 pKa = 4.3NSYY115 pKa = 11.63GSGNNNSSSYY125 pKa = 10.9GSSGRR130 pKa = 11.84NNDD133 pKa = 3.11NDD135 pKa = 3.28NSYY138 pKa = 11.64GSGNNNSSSYY148 pKa = 11.43GSGNNNLSSYY158 pKa = 11.31GSGNNNSSYY167 pKa = 11.57GNNNDD172 pKa = 3.21NDD174 pKa = 4.58SYY176 pKa = 11.41GSSGRR181 pKa = 11.84GGNNSSSYY189 pKa = 11.01GGNNDD194 pKa = 3.21NDD196 pKa = 4.42SYY198 pKa = 11.83ASSGRR203 pKa = 11.84NNDD206 pKa = 3.13NDD208 pKa = 4.25SYY210 pKa = 11.29GSSGRR215 pKa = 11.84GGNSGGFGSSNDD227 pKa = 3.28NDD229 pKa = 4.41SYY231 pKa = 11.48GSSGRR236 pKa = 11.84GGNSGGYY243 pKa = 9.83GGSNDD248 pKa = 3.34NDD250 pKa = 4.27SYY252 pKa = 11.53GSSGRR257 pKa = 11.84GGSGYY262 pKa = 11.25GNDD265 pKa = 3.78NSDD268 pKa = 4.55SYY270 pKa = 11.96GSSNNNNNDD279 pKa = 3.27YY280 pKa = 11.48
Molecular weight: 28.47 kDa
Isoelectric point according different methods:
Protein with the highest isoelectric point:
>tr|M9MHQ1|M9MHQ1_PSEA3 Isoform of M9LS63 Uncharacterized protein (Fragment) OS=Pseudozyma antarctica (strain T-34) OX=1151754 GN=PANT_20c00055 PE=4 SV=1
RR1 pKa = 7.66RR2 pKa = 11.84RR3 pKa = 11.84QRR5 pKa = 11.84QQGRR9 pKa = 11.84QRR11 pKa = 11.84RR12 pKa = 11.84QRR14 pKa = 11.84QVRR17 pKa = 11.84QQ18 pKa = 3.09
RR1 pKa = 7.66RR2 pKa = 11.84RR3 pKa = 11.84QRR5 pKa = 11.84QQGRR9 pKa = 11.84QRR11 pKa = 11.84RR12 pKa = 11.84QRR14 pKa = 11.84QVRR17 pKa = 11.84QQ18 pKa = 3.09
Molecular weight: 2.48 kDa
Isoelectric point according different methods:
Peptides (in silico digests for buttom-up proteomics)
Below you can find in silico digests of the whole proteome with Trypsin, Chymotrypsin, Trypsin+LysC, LysN, ArgC proteases suitable for different mass spec machines.| Try ESI |
 |
|---|
| ChTry ESI |
 |
|---|
| ArgC ESI |
 |
|---|
| LysN ESI |
 |
|---|
| TryLysC ESI |
 |
|---|
| Try MALDI |
 |
|---|
| ChTry MALDI |
 |
|---|
| ArgC MALDI |
 |
|---|
| LysN MALDI |
 |
|---|
| TryLysC MALDI |
 |
|---|
| Try LTQ |
 |
|---|
| ChTry LTQ |
 |
|---|
| ArgC LTQ |
 |
|---|
| LysN LTQ |
 |
|---|
| TryLysC LTQ |
 |
|---|
| Try MSlow |
 |
|---|
| ChTry MSlow |
 |
|---|
| ArgC MSlow |
 |
|---|
| LysN MSlow |
 |
|---|
| TryLysC MSlow |
 |
|---|
| Try MShigh |
 |
|---|
| ChTry MShigh |
 |
|---|
| ArgC MShigh |
 |
|---|
| LysN MShigh |
 |
|---|
| TryLysC MShigh |
 |
|---|
General Statistics
Number of major isoforms |
Number of additional isoforms |
Number of all proteins |
Number of amino acids |
Min. Seq. Length |
Max. Seq. Length |
Avg. Seq. Length |
Avg. Mol. Weight |
|---|---|---|---|---|---|---|---|
4029301 |
18 |
6082 |
606.8 |
65.84 |
Amino acid frequency
Ala |
Cys |
Asp |
Glu |
Phe |
Gly |
His |
Ile |
Lys |
Leu |
|---|---|---|---|---|---|---|---|---|---|
11.693 ± 0.032 | 0.99 ± 0.009 |
5.879 ± 0.022 | 5.388 ± 0.025 |
3.182 ± 0.016 | 6.773 ± 0.031 |
2.594 ± 0.014 | 3.799 ± 0.02 |
4.178 ± 0.024 | 8.863 ± 0.029 |
Met |
Asn |
Gln |
Pro |
Arg |
Ser |
Thr |
Val |
Trp |
Tyr |
|---|---|---|---|---|---|---|---|---|---|
1.921 ± 0.009 | 2.997 ± 0.016 |
6.372 ± 0.027 | 4.204 ± 0.022 |
6.661 ± 0.027 | 9.525 ± 0.041 |
5.721 ± 0.016 | 5.877 ± 0.021 |
1.2 ± 0.009 | 2.182 ± 0.016 |
Most of the basic statistics you can see at this page can be downloaded from this CSV file
Proteome-pI is available under Creative Commons Attribution-NoDerivs license, for more details see here
| Reference: Kozlowski LP. Proteome-pI 2.0: Proteome Isoelectric Point Database Update. Nucleic Acids Res. 2021, doi: 10.1093/nar/gkab944 | Contact: Lukasz P. Kozlowski |
