Mandrillus leucophaeus cytomegalovirus
Taxonomy: Viruses; Duplodnaviria; Heunggongvirae; Peploviricota; Herviviricetes; Herpesvirales; Herpesviridae; Betaherpesvirinae; Cytomegalovirus; Mandrilline betaherpesvirus 1
Average proteome isoelectric point is 7.01
Get precalculated fractions of proteins

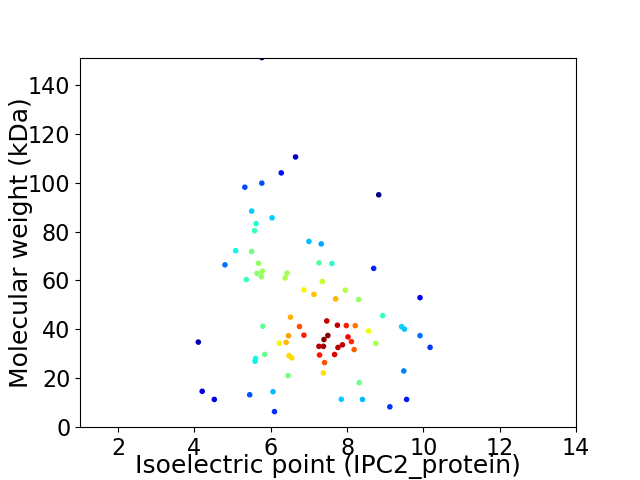
Virtual 2D-PAGE plot for 81 proteins (isoelectric point calculated using IPC2_protein)
Get csv file with sequences according to given criteria:
* You can choose from 21 different methods for calculating isoelectric point
Summary statistics related to proteome-wise predictions


Protein with the lowest isoelectric point:
>tr|A0A0G2UPC3|A0A0G2UPC3_SCMVC Envelope glycoprotein M OS=Mandrillus leucophaeus cytomegalovirus OX=1654930 GN=UL100 PE=3 SV=1
MM1 pKa = 6.96RR2 pKa = 11.84QAMRR6 pKa = 11.84GRR8 pKa = 11.84VLLVALFAITGGTAVAANNTTTTNASTSTAVITTTVPTSSTNTTTATTSPATTNVSSASPASSPATTNSTQTTATSSSTIISSSSAVTTGVTTSTSSNNTSITTASNSTSATNTNGTVTPTSEE131 pKa = 4.62LNVTTTVDD139 pKa = 3.11STTDD143 pKa = 3.35YY144 pKa = 11.77SNEE147 pKa = 4.08TFNATTPDD155 pKa = 4.32PYY157 pKa = 11.0TPLQIVDD164 pKa = 4.52LCNEE168 pKa = 4.47TIAIVFRR175 pKa = 11.84DD176 pKa = 3.46EE177 pKa = 5.07DD178 pKa = 4.14GEE180 pKa = 4.15PEE182 pKa = 4.11EE183 pKa = 4.39NSRR186 pKa = 11.84SSEE189 pKa = 4.14EE190 pKa = 3.97ADD192 pKa = 3.19SKK194 pKa = 11.46YY195 pKa = 11.15DD196 pKa = 3.69SNEE199 pKa = 3.56DD200 pKa = 3.03TTYY203 pKa = 10.33FPQGPGYY210 pKa = 8.32TLSSDD215 pKa = 3.61SDD217 pKa = 3.74DD218 pKa = 5.42AIYY221 pKa = 9.63FYY223 pKa = 11.59ANCEE227 pKa = 4.25RR228 pKa = 11.84NDD230 pKa = 3.21TSQNVTSCNYY240 pKa = 8.96TNQPLTSWSLVTSVSFYY257 pKa = 10.42PAEE260 pKa = 4.04LTNCKK265 pKa = 10.08QPVAVIQVGNNSLVVSAEE283 pKa = 3.92ATSNLVDD290 pKa = 5.4AIYY293 pKa = 10.63KK294 pKa = 10.13VLGFPDD300 pKa = 4.32LSSSFLKK307 pKa = 10.72EE308 pKa = 3.6LGKK311 pKa = 9.97FQHH314 pKa = 7.14LIIQGQTEE322 pKa = 3.99RR323 pKa = 11.84QKK325 pKa = 10.65WVTVEE330 pKa = 3.75
MM1 pKa = 6.96RR2 pKa = 11.84QAMRR6 pKa = 11.84GRR8 pKa = 11.84VLLVALFAITGGTAVAANNTTTTNASTSTAVITTTVPTSSTNTTTATTSPATTNVSSASPASSPATTNSTQTTATSSSTIISSSSAVTTGVTTSTSSNNTSITTASNSTSATNTNGTVTPTSEE131 pKa = 4.62LNVTTTVDD139 pKa = 3.11STTDD143 pKa = 3.35YY144 pKa = 11.77SNEE147 pKa = 4.08TFNATTPDD155 pKa = 4.32PYY157 pKa = 11.0TPLQIVDD164 pKa = 4.52LCNEE168 pKa = 4.47TIAIVFRR175 pKa = 11.84DD176 pKa = 3.46EE177 pKa = 5.07DD178 pKa = 4.14GEE180 pKa = 4.15PEE182 pKa = 4.11EE183 pKa = 4.39NSRR186 pKa = 11.84SSEE189 pKa = 4.14EE190 pKa = 3.97ADD192 pKa = 3.19SKK194 pKa = 11.46YY195 pKa = 11.15DD196 pKa = 3.69SNEE199 pKa = 3.56DD200 pKa = 3.03TTYY203 pKa = 10.33FPQGPGYY210 pKa = 8.32TLSSDD215 pKa = 3.61SDD217 pKa = 3.74DD218 pKa = 5.42AIYY221 pKa = 9.63FYY223 pKa = 11.59ANCEE227 pKa = 4.25RR228 pKa = 11.84NDD230 pKa = 3.21TSQNVTSCNYY240 pKa = 8.96TNQPLTSWSLVTSVSFYY257 pKa = 10.42PAEE260 pKa = 4.04LTNCKK265 pKa = 10.08QPVAVIQVGNNSLVVSAEE283 pKa = 3.92ATSNLVDD290 pKa = 5.4AIYY293 pKa = 10.63KK294 pKa = 10.13VLGFPDD300 pKa = 4.32LSSSFLKK307 pKa = 10.72EE308 pKa = 3.6LGKK311 pKa = 9.97FQHH314 pKa = 7.14LIIQGQTEE322 pKa = 3.99RR323 pKa = 11.84QKK325 pKa = 10.65WVTVEE330 pKa = 3.75
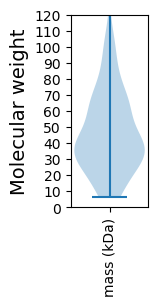
Molecular weight: 34.8 kDa
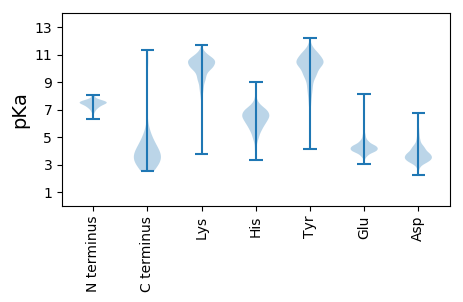
Isoelectric point according different methods:
Protein with the highest isoelectric point:
>tr|A0A0G2UGL5|A0A0G2UGL5_SCMVC DNA replication helicase OS=Mandrillus leucophaeus cytomegalovirus OX=1654930 GN=UL105 PE=3 SV=1
MM1 pKa = 7.56VLYY4 pKa = 9.78QYY6 pKa = 11.29RR7 pKa = 11.84NAVQLLSARR16 pKa = 11.84PRR18 pKa = 11.84DD19 pKa = 3.8GPGRR23 pKa = 11.84WEE25 pKa = 4.17RR26 pKa = 11.84LTHH29 pKa = 5.79HH30 pKa = 7.14AAYY33 pKa = 8.64TADD36 pKa = 4.08HH37 pKa = 6.57GACTVLMATSQRR49 pKa = 11.84RR50 pKa = 11.84SLVLRR55 pKa = 11.84RR56 pKa = 11.84HH57 pKa = 5.15SAISAVTLRR66 pKa = 11.84LIPDD70 pKa = 4.68KK71 pKa = 10.52ILKK74 pKa = 9.81KK75 pKa = 10.71LEE77 pKa = 3.86VSDD80 pKa = 4.06WVPGAWIASEE90 pKa = 4.25TFPTSDD96 pKa = 3.28ISGLRR101 pKa = 3.39
MM1 pKa = 7.56VLYY4 pKa = 9.78QYY6 pKa = 11.29RR7 pKa = 11.84NAVQLLSARR16 pKa = 11.84PRR18 pKa = 11.84DD19 pKa = 3.8GPGRR23 pKa = 11.84WEE25 pKa = 4.17RR26 pKa = 11.84LTHH29 pKa = 5.79HH30 pKa = 7.14AAYY33 pKa = 8.64TADD36 pKa = 4.08HH37 pKa = 6.57GACTVLMATSQRR49 pKa = 11.84RR50 pKa = 11.84SLVLRR55 pKa = 11.84RR56 pKa = 11.84HH57 pKa = 5.15SAISAVTLRR66 pKa = 11.84LIPDD70 pKa = 4.68KK71 pKa = 10.52ILKK74 pKa = 9.81KK75 pKa = 10.71LEE77 pKa = 3.86VSDD80 pKa = 4.06WVPGAWIASEE90 pKa = 4.25TFPTSDD96 pKa = 3.28ISGLRR101 pKa = 3.39
Molecular weight: 11.35 kDa
Isoelectric point according different methods:
Peptides (in silico digests for buttom-up proteomics)
Below you can find in silico digests of the whole proteome with Trypsin, Chymotrypsin, Trypsin+LysC, LysN, ArgC proteases suitable for different mass spec machines.| Try ESI |
 |
|---|
| ChTry ESI |
 |
|---|
| ArgC ESI |
 |
|---|
| LysN ESI |
 |
|---|
| TryLysC ESI |
 |
|---|
| Try MALDI |
 |
|---|
| ChTry MALDI |
 |
|---|
| ArgC MALDI |
 |
|---|
| LysN MALDI |
 |
|---|
| TryLysC MALDI |
 |
|---|
| Try LTQ |
 |
|---|
| ChTry LTQ |
 |
|---|
| ArgC LTQ |
 |
|---|
| LysN LTQ |
 |
|---|
| TryLysC LTQ |
 |
|---|
| Try MSlow |
 |
|---|
| ChTry MSlow |
 |
|---|
| ArgC MSlow |
 |
|---|
| LysN MSlow |
 |
|---|
| TryLysC MSlow |
 |
|---|
| Try MShigh |
 |
|---|
| ChTry MShigh |
 |
|---|
| ArgC MShigh |
 |
|---|
| LysN MShigh |
 |
|---|
| TryLysC MShigh |
 |
|---|
General Statistics
Number of major isoforms |
Number of additional isoforms |
Number of all proteins |
Number of amino acids |
Min. Seq. Length |
Max. Seq. Length |
Avg. Seq. Length |
Avg. Mol. Weight |
|---|---|---|---|---|---|---|---|
0 |
34073 |
56 |
1343 |
420.7 |
47.53 |
Amino acid frequency
Ala |
Cys |
Asp |
Glu |
Phe |
Gly |
His |
Ile |
Lys |
Leu |
|---|---|---|---|---|---|---|---|---|---|
7.102 ± 0.221 | 2.533 ± 0.131 |
4.995 ± 0.18 | 5.206 ± 0.208 |
4.153 ± 0.138 | 4.746 ± 0.199 |
3.24 ± 0.15 | 4.658 ± 0.164 |
3.601 ± 0.215 | 10.043 ± 0.245 |
Met |
Asn |
Gln |
Pro |
Arg |
Ser |
Thr |
Val |
Trp |
Tyr |
|---|---|---|---|---|---|---|---|---|---|
2.374 ± 0.117 | 4.027 ± 0.164 |
5.761 ± 0.269 | 3.686 ± 0.136 |
6.997 ± 0.255 | 7.739 ± 0.26 |
6.935 ± 0.352 | 7.237 ± 0.206 |
1.385 ± 0.11 | 3.581 ± 0.128 |
Most of the basic statistics you can see at this page can be downloaded from this CSV file
Proteome-pI is available under Creative Commons Attribution-NoDerivs license, for more details see here
| Reference: Kozlowski LP. Proteome-pI 2.0: Proteome Isoelectric Point Database Update. Nucleic Acids Res. 2021, doi: 10.1093/nar/gkab944 | Contact: Lukasz P. Kozlowski |
