Thermophagus xiamenensis
Taxonomy: cellular organisms; Bacteria; FCB group; Bacteroidetes/Chlorobi group; Bacteroidetes; Bacteroidia; Marinilabiliales; Marinilabiliaceae; Thermophagus
Average proteome isoelectric point is 6.73
Get precalculated fractions of proteins

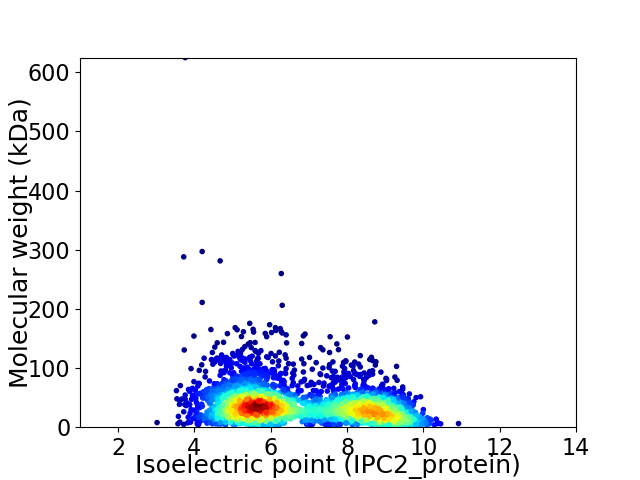
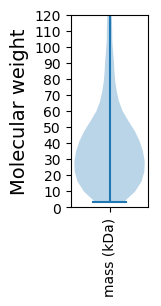
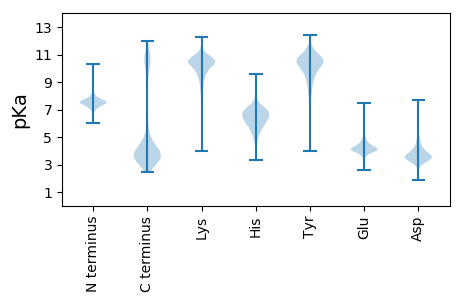
Virtual 2D-PAGE plot for 3056 proteins (isoelectric point calculated using IPC2_protein)
Get csv file with sequences according to given criteria:
* You can choose from 21 different methods for calculating isoelectric point
Summary statistics related to proteome-wise predictions


Protein with the lowest isoelectric point:
>tr|A0A1I1X3B3|A0A1I1X3B3_9BACT Glycosyltransferase GT2 family OS=Thermophagus xiamenensis OX=385682 GN=SAMN05444380_10567 PE=4 SV=1
MM1 pKa = 7.86PIKK4 pKa = 10.69SSTGKK9 pKa = 10.58YY10 pKa = 9.99LFPLLLFFITIGSKK24 pKa = 10.76GNNVTLSLTGGLLSEE39 pKa = 4.47GDD41 pKa = 3.5EE42 pKa = 4.32MVISRR47 pKa = 11.84LAGGSVLINRR57 pKa = 11.84THH59 pKa = 7.04EE60 pKa = 4.54IIPAHH65 pKa = 5.55SVKK68 pKa = 10.42AYY70 pKa = 8.72PVRR73 pKa = 11.84SNTTEE78 pKa = 3.7MTGVEE83 pKa = 3.73IAQANEE89 pKa = 4.02GPILSDD95 pKa = 4.23DD96 pKa = 4.79EE97 pKa = 5.18YY98 pKa = 11.32NTDD101 pKa = 3.24QDD103 pKa = 3.55RR104 pKa = 11.84VLNGSSLLDD113 pKa = 3.61NDD115 pKa = 4.02EE116 pKa = 5.01DD117 pKa = 4.6PNGDD121 pKa = 3.43EE122 pKa = 5.59LMINTTPVSPPEE134 pKa = 4.47HH135 pKa = 5.81GTLVINPDD143 pKa = 2.93GTFTYY148 pKa = 10.08TPHH151 pKa = 6.65QGFAGTDD158 pKa = 3.39SFVYY162 pKa = 9.06EE163 pKa = 4.41ACDD166 pKa = 3.43NGDD169 pKa = 3.88PPLCATASVSILVVEE184 pKa = 4.94VADD187 pKa = 4.56HH188 pKa = 7.29DD189 pKa = 4.17NDD191 pKa = 5.08GIPTEE196 pKa = 4.14EE197 pKa = 4.37EE198 pKa = 4.89GYY200 pKa = 10.36IDD202 pKa = 4.28TDD204 pKa = 3.12NDD206 pKa = 4.68GIPNYY211 pKa = 10.34LDD213 pKa = 4.39PDD215 pKa = 3.9SDD217 pKa = 4.0NDD219 pKa = 3.76GMGDD223 pKa = 3.62AEE225 pKa = 5.33EE226 pKa = 4.74GTGDD230 pKa = 4.42CDD232 pKa = 3.75SDD234 pKa = 4.59QIPDD238 pKa = 3.84YY239 pKa = 11.12LDD241 pKa = 3.62TDD243 pKa = 3.77PCFTVPEE250 pKa = 4.69GFSPNDD256 pKa = 3.44DD257 pKa = 4.56GINEE261 pKa = 4.11VLNIRR266 pKa = 11.84WVQLYY271 pKa = 9.07NQVSIMIFNRR281 pKa = 11.84WGSTVFRR288 pKa = 11.84EE289 pKa = 4.45EE290 pKa = 4.14NFSGQWDD297 pKa = 4.03GLSNTGITIGKK308 pKa = 8.74KK309 pKa = 10.15LPAGTYY315 pKa = 9.93YY316 pKa = 10.88YY317 pKa = 9.96IITIGDD323 pKa = 3.6INKK326 pKa = 9.85KK327 pKa = 9.74ISGNIYY333 pKa = 8.47MAWW336 pKa = 3.19
MM1 pKa = 7.86PIKK4 pKa = 10.69SSTGKK9 pKa = 10.58YY10 pKa = 9.99LFPLLLFFITIGSKK24 pKa = 10.76GNNVTLSLTGGLLSEE39 pKa = 4.47GDD41 pKa = 3.5EE42 pKa = 4.32MVISRR47 pKa = 11.84LAGGSVLINRR57 pKa = 11.84THH59 pKa = 7.04EE60 pKa = 4.54IIPAHH65 pKa = 5.55SVKK68 pKa = 10.42AYY70 pKa = 8.72PVRR73 pKa = 11.84SNTTEE78 pKa = 3.7MTGVEE83 pKa = 3.73IAQANEE89 pKa = 4.02GPILSDD95 pKa = 4.23DD96 pKa = 4.79EE97 pKa = 5.18YY98 pKa = 11.32NTDD101 pKa = 3.24QDD103 pKa = 3.55RR104 pKa = 11.84VLNGSSLLDD113 pKa = 3.61NDD115 pKa = 4.02EE116 pKa = 5.01DD117 pKa = 4.6PNGDD121 pKa = 3.43EE122 pKa = 5.59LMINTTPVSPPEE134 pKa = 4.47HH135 pKa = 5.81GTLVINPDD143 pKa = 2.93GTFTYY148 pKa = 10.08TPHH151 pKa = 6.65QGFAGTDD158 pKa = 3.39SFVYY162 pKa = 9.06EE163 pKa = 4.41ACDD166 pKa = 3.43NGDD169 pKa = 3.88PPLCATASVSILVVEE184 pKa = 4.94VADD187 pKa = 4.56HH188 pKa = 7.29DD189 pKa = 4.17NDD191 pKa = 5.08GIPTEE196 pKa = 4.14EE197 pKa = 4.37EE198 pKa = 4.89GYY200 pKa = 10.36IDD202 pKa = 4.28TDD204 pKa = 3.12NDD206 pKa = 4.68GIPNYY211 pKa = 10.34LDD213 pKa = 4.39PDD215 pKa = 3.9SDD217 pKa = 4.0NDD219 pKa = 3.76GMGDD223 pKa = 3.62AEE225 pKa = 5.33EE226 pKa = 4.74GTGDD230 pKa = 4.42CDD232 pKa = 3.75SDD234 pKa = 4.59QIPDD238 pKa = 3.84YY239 pKa = 11.12LDD241 pKa = 3.62TDD243 pKa = 3.77PCFTVPEE250 pKa = 4.69GFSPNDD256 pKa = 3.44DD257 pKa = 4.56GINEE261 pKa = 4.11VLNIRR266 pKa = 11.84WVQLYY271 pKa = 9.07NQVSIMIFNRR281 pKa = 11.84WGSTVFRR288 pKa = 11.84EE289 pKa = 4.45EE290 pKa = 4.14NFSGQWDD297 pKa = 4.03GLSNTGITIGKK308 pKa = 8.74KK309 pKa = 10.15LPAGTYY315 pKa = 9.93YY316 pKa = 10.88YY317 pKa = 9.96IITIGDD323 pKa = 3.6INKK326 pKa = 9.85KK327 pKa = 9.74ISGNIYY333 pKa = 8.47MAWW336 pKa = 3.19
Molecular weight: 36.5 kDa
Isoelectric point according different methods:
Protein with the highest isoelectric point:
>tr|A0A1I2AEW0|A0A1I2AEW0_9BACT Starch-binding associating with outer membrane OS=Thermophagus xiamenensis OX=385682 GN=SAMN05444380_11147 PE=3 SV=1
MM1 pKa = 7.35KK2 pKa = 9.44RR3 pKa = 11.84TYY5 pKa = 10.31QPSNRR10 pKa = 11.84KK11 pKa = 8.88RR12 pKa = 11.84RR13 pKa = 11.84NKK15 pKa = 9.98HH16 pKa = 4.03GFRR19 pKa = 11.84SRR21 pKa = 11.84MKK23 pKa = 8.04TATGRR28 pKa = 11.84RR29 pKa = 11.84VLAARR34 pKa = 11.84RR35 pKa = 11.84AKK37 pKa = 10.01GRR39 pKa = 11.84KK40 pKa = 8.51KK41 pKa = 9.9LTVSSEE47 pKa = 4.22RR48 pKa = 11.84KK49 pKa = 9.44HH50 pKa = 6.03KK51 pKa = 10.83AA52 pKa = 2.84
MM1 pKa = 7.35KK2 pKa = 9.44RR3 pKa = 11.84TYY5 pKa = 10.31QPSNRR10 pKa = 11.84KK11 pKa = 8.88RR12 pKa = 11.84RR13 pKa = 11.84NKK15 pKa = 9.98HH16 pKa = 4.03GFRR19 pKa = 11.84SRR21 pKa = 11.84MKK23 pKa = 8.04TATGRR28 pKa = 11.84RR29 pKa = 11.84VLAARR34 pKa = 11.84RR35 pKa = 11.84AKK37 pKa = 10.01GRR39 pKa = 11.84KK40 pKa = 8.51KK41 pKa = 9.9LTVSSEE47 pKa = 4.22RR48 pKa = 11.84KK49 pKa = 9.44HH50 pKa = 6.03KK51 pKa = 10.83AA52 pKa = 2.84
Molecular weight: 6.18 kDa
Isoelectric point according different methods:
Peptides (in silico digests for buttom-up proteomics)
Below you can find in silico digests of the whole proteome with Trypsin, Chymotrypsin, Trypsin+LysC, LysN, ArgC proteases suitable for different mass spec machines.| Try ESI |
 |
|---|
| ChTry ESI |
 |
|---|
| ArgC ESI |
 |
|---|
| LysN ESI |
 |
|---|
| TryLysC ESI |
 |
|---|
| Try MALDI |
 |
|---|
| ChTry MALDI |
 |
|---|
| ArgC MALDI |
 |
|---|
| LysN MALDI |
 |
|---|
| TryLysC MALDI |
 |
|---|
| Try LTQ |
 |
|---|
| ChTry LTQ |
 |
|---|
| ArgC LTQ |
 |
|---|
| LysN LTQ |
 |
|---|
| TryLysC LTQ |
 |
|---|
| Try MSlow |
 |
|---|
| ChTry MSlow |
 |
|---|
| ArgC MSlow |
 |
|---|
| LysN MSlow |
 |
|---|
| TryLysC MSlow |
 |
|---|
| Try MShigh |
 |
|---|
| ChTry MShigh |
 |
|---|
| ArgC MShigh |
 |
|---|
| LysN MShigh |
 |
|---|
| TryLysC MShigh |
 |
|---|
General Statistics
Number of major isoforms |
Number of additional isoforms |
Number of all proteins |
Number of amino acids |
Min. Seq. Length |
Max. Seq. Length |
Avg. Seq. Length |
Avg. Mol. Weight |
|---|---|---|---|---|---|---|---|
0 |
1082107 |
29 |
5932 |
354.1 |
40.09 |
Amino acid frequency
Ala |
Cys |
Asp |
Glu |
Phe |
Gly |
His |
Ile |
Lys |
Leu |
|---|---|---|---|---|---|---|---|---|---|
6.225 ± 0.042 | 0.805 ± 0.016 |
5.453 ± 0.032 | 6.716 ± 0.039 |
5.168 ± 0.038 | 6.791 ± 0.046 |
1.975 ± 0.022 | 7.649 ± 0.039 |
6.884 ± 0.06 | 9.447 ± 0.044 |
Met |
Asn |
Gln |
Pro |
Arg |
Ser |
Thr |
Val |
Trp |
Tyr |
|---|---|---|---|---|---|---|---|---|---|
2.35 ± 0.022 | 5.458 ± 0.037 |
3.994 ± 0.026 | 3.491 ± 0.025 |
4.481 ± 0.033 | 6.314 ± 0.043 |
5.112 ± 0.052 | 6.402 ± 0.041 |
1.285 ± 0.018 | 3.999 ± 0.032 |
Most of the basic statistics you can see at this page can be downloaded from this CSV file
Proteome-pI is available under Creative Commons Attribution-NoDerivs license, for more details see here
| Reference: Kozlowski LP. Proteome-pI 2.0: Proteome Isoelectric Point Database Update. Nucleic Acids Res. 2021, doi: 10.1093/nar/gkab944 | Contact: Lukasz P. Kozlowski |
