Sphingobium algorifonticola
Taxonomy: cellular organisms; Bacteria; Proteobacteria; Alphaproteobacteria; Sphingomonadales; Sphingomonadaceae; Sphingobium
Average proteome isoelectric point is 6.58
Get precalculated fractions of proteins
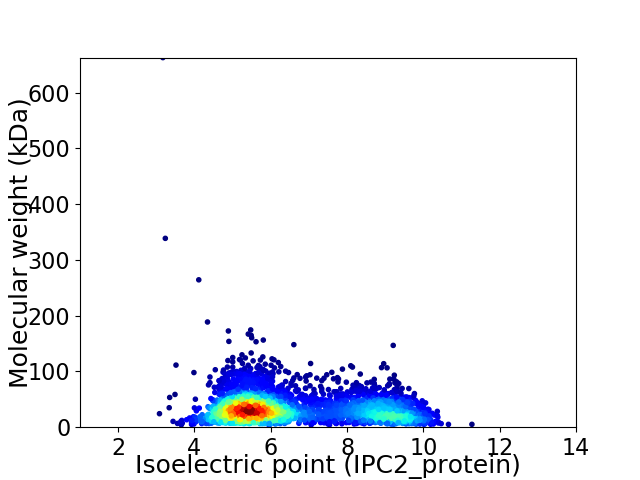
Virtual 2D-PAGE plot for 3506 proteins (isoelectric point calculated using IPC2_protein)
Get csv file with sequences according to given criteria:
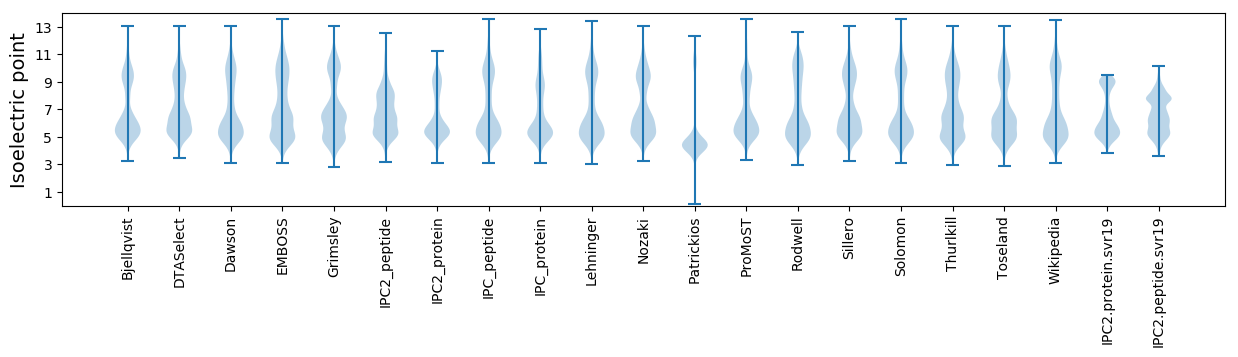
* You can choose from 21 different methods for calculating isoelectric point
Summary statistics related to proteome-wise predictions
Protein with the lowest isoelectric point:
>tr|A0A437JCF2|A0A437JCF2_9SPHN Uncharacterized protein OS=Sphingobium algorifonticola OX=2008318 GN=ENE74_03065 PE=4 SV=1
MM1 pKa = 7.38RR2 pKa = 11.84TISSDD7 pKa = 3.33VTVRR11 pKa = 11.84LYY13 pKa = 11.25YY14 pKa = 10.49LDD16 pKa = 4.45EE17 pKa = 6.26GDD19 pKa = 4.0GAAASTLAYY28 pKa = 10.32APLSQALALAAAQPEE43 pKa = 4.36AVQAGLFVQTDD54 pKa = 3.48NDD56 pKa = 3.78VIAYY60 pKa = 9.99LDD62 pKa = 4.89LIAEE66 pKa = 4.5
MM1 pKa = 7.38RR2 pKa = 11.84TISSDD7 pKa = 3.33VTVRR11 pKa = 11.84LYY13 pKa = 11.25YY14 pKa = 10.49LDD16 pKa = 4.45EE17 pKa = 6.26GDD19 pKa = 4.0GAAASTLAYY28 pKa = 10.32APLSQALALAAAQPEE43 pKa = 4.36AVQAGLFVQTDD54 pKa = 3.48NDD56 pKa = 3.78VIAYY60 pKa = 9.99LDD62 pKa = 4.89LIAEE66 pKa = 4.5
Molecular weight: 6.93 kDa
Isoelectric point according different methods:
Protein with the highest isoelectric point:
>tr|A0A437JAG3|A0A437JAG3_9SPHN Mandelate racemase/muconate lactonizing enzyme family protein OS=Sphingobium algorifonticola OX=2008318 GN=ENE74_08810 PE=4 SV=1
MM1 pKa = 7.45KK2 pKa = 9.61RR3 pKa = 11.84TFQPSNLVRR12 pKa = 11.84KK13 pKa = 9.18RR14 pKa = 11.84RR15 pKa = 11.84HH16 pKa = 4.42GFRR19 pKa = 11.84ARR21 pKa = 11.84MATVGGRR28 pKa = 11.84NILRR32 pKa = 11.84ARR34 pKa = 11.84RR35 pKa = 11.84SRR37 pKa = 11.84GRR39 pKa = 11.84KK40 pKa = 9.06SLSAA44 pKa = 3.93
MM1 pKa = 7.45KK2 pKa = 9.61RR3 pKa = 11.84TFQPSNLVRR12 pKa = 11.84KK13 pKa = 9.18RR14 pKa = 11.84RR15 pKa = 11.84HH16 pKa = 4.42GFRR19 pKa = 11.84ARR21 pKa = 11.84MATVGGRR28 pKa = 11.84NILRR32 pKa = 11.84ARR34 pKa = 11.84RR35 pKa = 11.84SRR37 pKa = 11.84GRR39 pKa = 11.84KK40 pKa = 9.06SLSAA44 pKa = 3.93
Molecular weight: 5.14 kDa
Isoelectric point according different methods:
Peptides (in silico digests for buttom-up proteomics)
Below you can find in silico digests of the whole proteome with Trypsin, Chymotrypsin, Trypsin+LysC, LysN, ArgC proteases suitable for different mass spec machines.| Try ESI |
 |
|---|
| ChTry ESI |
|
|---|
| ArgC ESI |
|
|---|
| LysN ESI |
|
|---|
| TryLysC ESI |
|
|---|
| Try MALDI |
|
|---|
| ChTry MALDI |
|
|---|
| ArgC MALDI |
|
|---|
| LysN MALDI |
|
|---|
| TryLysC MALDI |
|
|---|
| Try LTQ |
|
|---|
| ChTry LTQ |
|
|---|
| ArgC LTQ |
|
|---|
| LysN LTQ |
|
|---|
| TryLysC LTQ |
|
|---|
| Try MSlow |
|
|---|
| ChTry MSlow |
|
|---|
| ArgC MSlow |
|
|---|
| LysN MSlow |
|
|---|
| TryLysC MSlow |
|
|---|
| Try MShigh |
|
|---|
| ChTry MShigh |
|
|---|
| ArgC MShigh |
|
|---|
| LysN MShigh |
|
|---|
| TryLysC MShigh |
|
|---|
General Statistics
Number of major isoforms |
Number of additional isoforms |
Number of all proteins |
Number of amino acids |
Min. Seq. Length |
Max. Seq. Length |
Avg. Seq. Length |
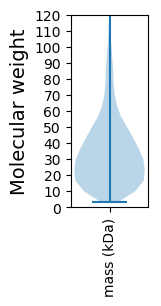
Avg. Mol. Weight |
|---|---|---|---|---|---|---|---|
0 |
1150749 |
29 |
6979 |
328.2 |
35.41 |
Amino acid frequency
Ala |
Cys |
Asp |
Glu |
Phe |
Gly |
His |
Ile |
Lys |
Leu |
|---|---|---|---|---|---|---|---|---|---|
13.416 ± 0.061 | 0.835 ± 0.015 |
6.276 ± 0.062 | 4.844 ± 0.044 |
3.525 ± 0.032 | 8.876 ± 0.109 |
2.003 ± 0.029 | 5.27 ± 0.026 |
2.84 ± 0.034 | 9.807 ± 0.053 |
Met |
Asn |
Gln |
Pro |
Arg |
Ser |
Thr |
Val |
Trp |
Tyr |
|---|---|---|---|---|---|---|---|---|---|
2.558 ± 0.03 | 2.564 ± 0.037 |
5.283 ± 0.043 | 3.211 ± 0.022 |
7.331 ± 0.058 | 5.271 ± 0.042 |
5.37 ± 0.048 | 7.086 ± 0.03 |
1.388 ± 0.021 | 2.245 ± 0.021 |
Most of the basic statistics you can see at this page can be downloaded from this CSV file
See this proteome in:

Proteome-pI is available under Creative Commons Attribution-NoDerivs license, for more details see here
| Reference: Kozlowski LP. Proteome-pI 2.0: Proteome Isoelectric Point Database Update. Nucleic Acids Res. 2021, doi: 10.1093/nar/gkab944 | Contact: Lukasz P. Kozlowski |