Escherichia phage JN01
Taxonomy: Viruses; Duplodnaviria; Heunggongvirae; Uroviricota; Caudoviricetes; Caudovirales; Myoviridae; Ounavirinae; Felixounavirus; unclassified Felixounavirus
Average proteome isoelectric point is 6.4
Get precalculated fractions of proteins

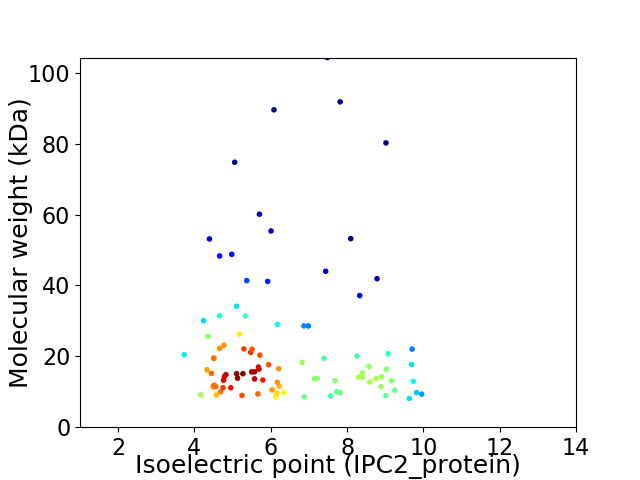
Virtual 2D-PAGE plot for 97 proteins (isoelectric point calculated using IPC2_protein)
Get csv file with sequences according to given criteria:
* You can choose from 21 different methods for calculating isoelectric point
Summary statistics related to proteome-wise predictions


Protein with the lowest isoelectric point:
>tr|A0A6B9SNY7|A0A6B9SNY7_9CAUD Uncharacterized protein OS=Escherichia phage JN01 OX=2692737 PE=4 SV=1
MM1 pKa = 7.47KK2 pKa = 9.8CFHH5 pKa = 6.61GTTQEE10 pKa = 3.93NFINLINNGDD20 pKa = 3.94KK21 pKa = 10.86PSGAWNCSDD30 pKa = 3.4MDD32 pKa = 4.16GNFYY36 pKa = 10.85VYY38 pKa = 10.1PEE40 pKa = 3.92NKK42 pKa = 9.54IYY44 pKa = 10.85GDD46 pKa = 3.97DD47 pKa = 3.63EE48 pKa = 4.51EE49 pKa = 5.5EE50 pKa = 4.57IISEE54 pKa = 5.02GIQQALGNATITAAFQMKK72 pKa = 7.87TQNIVILEE80 pKa = 4.02LDD82 pKa = 3.41IPEE85 pKa = 5.73DD86 pKa = 4.11EE87 pKa = 5.46LNDD90 pKa = 5.32DD91 pKa = 4.11YY92 pKa = 12.12SCDD95 pKa = 3.5NMSSVASFTEE105 pKa = 4.09YY106 pKa = 10.97FDD108 pKa = 5.33LNWIKK113 pKa = 10.48KK114 pKa = 9.52VYY116 pKa = 8.54VTEE119 pKa = 4.72FNAMFSPFCLPSLDD133 pKa = 4.18NPNLNYY139 pKa = 10.59LEE141 pKa = 4.25EE142 pKa = 4.19TLEE145 pKa = 4.14LLAKK149 pKa = 10.12SVQQSDD155 pKa = 4.51SIQVFCDD162 pKa = 3.04IMDD165 pKa = 4.29TLTGNITEE173 pKa = 4.49EE174 pKa = 4.13DD175 pKa = 3.63LKK177 pKa = 11.6SFLL180 pKa = 4.67
MM1 pKa = 7.47KK2 pKa = 9.8CFHH5 pKa = 6.61GTTQEE10 pKa = 3.93NFINLINNGDD20 pKa = 3.94KK21 pKa = 10.86PSGAWNCSDD30 pKa = 3.4MDD32 pKa = 4.16GNFYY36 pKa = 10.85VYY38 pKa = 10.1PEE40 pKa = 3.92NKK42 pKa = 9.54IYY44 pKa = 10.85GDD46 pKa = 3.97DD47 pKa = 3.63EE48 pKa = 4.51EE49 pKa = 5.5EE50 pKa = 4.57IISEE54 pKa = 5.02GIQQALGNATITAAFQMKK72 pKa = 7.87TQNIVILEE80 pKa = 4.02LDD82 pKa = 3.41IPEE85 pKa = 5.73DD86 pKa = 4.11EE87 pKa = 5.46LNDD90 pKa = 5.32DD91 pKa = 4.11YY92 pKa = 12.12SCDD95 pKa = 3.5NMSSVASFTEE105 pKa = 4.09YY106 pKa = 10.97FDD108 pKa = 5.33LNWIKK113 pKa = 10.48KK114 pKa = 9.52VYY116 pKa = 8.54VTEE119 pKa = 4.72FNAMFSPFCLPSLDD133 pKa = 4.18NPNLNYY139 pKa = 10.59LEE141 pKa = 4.25EE142 pKa = 4.19TLEE145 pKa = 4.14LLAKK149 pKa = 10.12SVQQSDD155 pKa = 4.51SIQVFCDD162 pKa = 3.04IMDD165 pKa = 4.29TLTGNITEE173 pKa = 4.49EE174 pKa = 4.13DD175 pKa = 3.63LKK177 pKa = 11.6SFLL180 pKa = 4.67
Molecular weight: 20.43 kDa
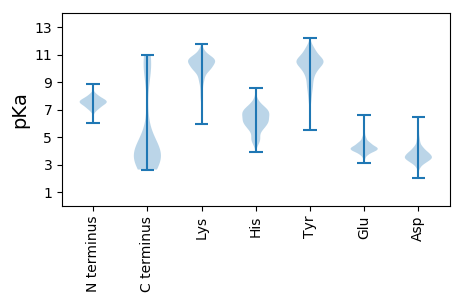
Isoelectric point according different methods:
Protein with the highest isoelectric point:
>tr|A0A6B9SP31|A0A6B9SP31_9CAUD Uncharacterized protein OS=Escherichia phage JN01 OX=2692737 PE=4 SV=1
MM1 pKa = 7.97LFRR4 pKa = 11.84LPFKK8 pKa = 10.22KK9 pKa = 8.99TFSEE13 pKa = 4.38PEE15 pKa = 3.78RR16 pKa = 11.84DD17 pKa = 3.57EE18 pKa = 5.39LSISLFILSNNFCLRR33 pKa = 11.84FLIVSFEE40 pKa = 4.08APFIIAAWVLPRR52 pKa = 11.84WLIVNSQYY60 pKa = 11.67LHH62 pKa = 6.16AHH64 pKa = 6.76LLSSLSYY71 pKa = 10.83LLRR74 pKa = 11.84FFPPAIKK81 pKa = 10.08ISTLRR86 pKa = 11.84RR87 pKa = 11.84TSGFTFKK94 pKa = 10.62FLQLLQRR101 pKa = 11.84TINIPSISFF110 pKa = 3.34
MM1 pKa = 7.97LFRR4 pKa = 11.84LPFKK8 pKa = 10.22KK9 pKa = 8.99TFSEE13 pKa = 4.38PEE15 pKa = 3.78RR16 pKa = 11.84DD17 pKa = 3.57EE18 pKa = 5.39LSISLFILSNNFCLRR33 pKa = 11.84FLIVSFEE40 pKa = 4.08APFIIAAWVLPRR52 pKa = 11.84WLIVNSQYY60 pKa = 11.67LHH62 pKa = 6.16AHH64 pKa = 6.76LLSSLSYY71 pKa = 10.83LLRR74 pKa = 11.84FFPPAIKK81 pKa = 10.08ISTLRR86 pKa = 11.84RR87 pKa = 11.84TSGFTFKK94 pKa = 10.62FLQLLQRR101 pKa = 11.84TINIPSISFF110 pKa = 3.34
Molecular weight: 12.94 kDa
Isoelectric point according different methods:
Peptides (in silico digests for buttom-up proteomics)
Below you can find in silico digests of the whole proteome with Trypsin, Chymotrypsin, Trypsin+LysC, LysN, ArgC proteases suitable for different mass spec machines.| Try ESI |
 |
|---|
| ChTry ESI |
 |
|---|
| ArgC ESI |
 |
|---|
| LysN ESI |
 |
|---|
| TryLysC ESI |
 |
|---|
| Try MALDI |
 |
|---|
| ChTry MALDI |
 |
|---|
| ArgC MALDI |
 |
|---|
| LysN MALDI |
 |
|---|
| TryLysC MALDI |
 |
|---|
| Try LTQ |
 |
|---|
| ChTry LTQ |
 |
|---|
| ArgC LTQ |
 |
|---|
| LysN LTQ |
 |
|---|
| TryLysC LTQ |
 |
|---|
| Try MSlow |
 |
|---|
| ChTry MSlow |
 |
|---|
| ArgC MSlow |
 |
|---|
| LysN MSlow |
 |
|---|
| TryLysC MSlow |
 |
|---|
| Try MShigh |
 |
|---|
| ChTry MShigh |
 |
|---|
| ArgC MShigh |
 |
|---|
| LysN MShigh |
 |
|---|
| TryLysC MShigh |
 |
|---|
General Statistics
Number of major isoforms |
Number of additional isoforms |
Number of all proteins |
Number of amino acids |
Min. Seq. Length |
Max. Seq. Length |
Avg. Seq. Length |
Avg. Mol. Weight |
|---|---|---|---|---|---|---|---|
0 |
19995 |
74 |
909 |
206.1 |
23.19 |
Amino acid frequency
Ala |
Cys |
Asp |
Glu |
Phe |
Gly |
His |
Ile |
Lys |
Leu |
|---|---|---|---|---|---|---|---|---|---|
6.932 ± 0.319 | 1.31 ± 0.135 |
6.022 ± 0.181 | 6.472 ± 0.291 |
4.301 ± 0.169 | 6.377 ± 0.263 |
1.925 ± 0.184 | 6.142 ± 0.176 |
7.497 ± 0.333 | 8.062 ± 0.178 |
Met |
Asn |
Gln |
Pro |
Arg |
Ser |
Thr |
Val |
Trp |
Tyr |
|---|---|---|---|---|---|---|---|---|---|
2.686 ± 0.164 | 5.561 ± 0.287 |
3.041 ± 0.159 | 3.566 ± 0.188 |
4.171 ± 0.159 | 6.867 ± 0.231 |
6.552 ± 0.311 | 7.232 ± 0.233 |
1.12 ± 0.106 | 4.166 ± 0.156 |
Most of the basic statistics you can see at this page can be downloaded from this CSV file
Proteome-pI is available under Creative Commons Attribution-NoDerivs license, for more details see here
| Reference: Kozlowski LP. Proteome-pI 2.0: Proteome Isoelectric Point Database Update. Nucleic Acids Res. 2021, doi: 10.1093/nar/gkab944 | Contact: Lukasz P. Kozlowski |
