Staphylococcus aureus
Taxonomy:
Average proteome isoelectric point is 6.29
Get precalculated fractions of proteins

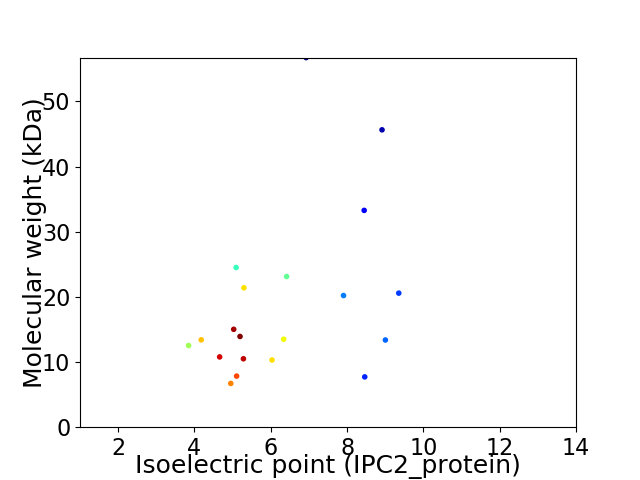
Virtual 2D-PAGE plot for 20 proteins (isoelectric point calculated using IPC2_protein)
Get csv file with sequences according to given criteria:
* You can choose from 21 different methods for calculating isoelectric point
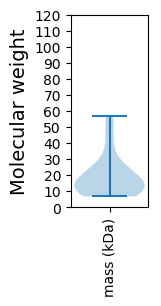
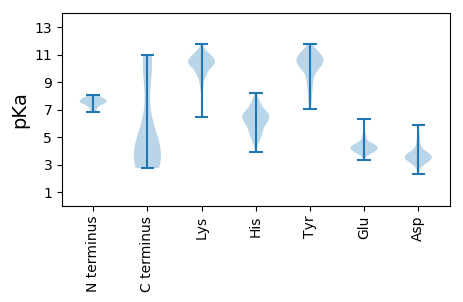
Summary statistics related to proteome-wise predictions


Protein with the lowest isoelectric point:
>tr|A0A1W6JQF8|A0A1W6JQF8_STAAU Pathogenicity island protein OS=Staphylococcus aureus OX=1280 PE=4 SV=1
MM1 pKa = 7.85ASQLFEE7 pKa = 5.36DD8 pKa = 4.86EE9 pKa = 4.28YY10 pKa = 11.57FMYY13 pKa = 10.87GLQTYY18 pKa = 10.27AEE20 pKa = 4.6SNNSDD25 pKa = 3.1VFEE28 pKa = 4.03YY29 pKa = 11.02LEE31 pKa = 4.58NGFDD35 pKa = 3.74TDD37 pKa = 3.69TLEE40 pKa = 5.82GIQSSNTDD48 pKa = 3.21VIANIEE54 pKa = 4.17MLYY57 pKa = 10.52QLATGINEE65 pKa = 4.14PATEE69 pKa = 3.94LVEE72 pKa = 4.14GLKK75 pKa = 10.73LVTEE79 pKa = 5.05FVQDD83 pKa = 3.54EE84 pKa = 4.36NATQEE89 pKa = 4.13DD90 pKa = 4.96YY91 pKa = 11.18KK92 pKa = 11.48ALEE95 pKa = 4.34RR96 pKa = 11.84KK97 pKa = 10.2LNDD100 pKa = 3.62LKK102 pKa = 11.21ASYY105 pKa = 10.83YY106 pKa = 10.56SLSKK110 pKa = 10.98
MM1 pKa = 7.85ASQLFEE7 pKa = 5.36DD8 pKa = 4.86EE9 pKa = 4.28YY10 pKa = 11.57FMYY13 pKa = 10.87GLQTYY18 pKa = 10.27AEE20 pKa = 4.6SNNSDD25 pKa = 3.1VFEE28 pKa = 4.03YY29 pKa = 11.02LEE31 pKa = 4.58NGFDD35 pKa = 3.74TDD37 pKa = 3.69TLEE40 pKa = 5.82GIQSSNTDD48 pKa = 3.21VIANIEE54 pKa = 4.17MLYY57 pKa = 10.52QLATGINEE65 pKa = 4.14PATEE69 pKa = 3.94LVEE72 pKa = 4.14GLKK75 pKa = 10.73LVTEE79 pKa = 5.05FVQDD83 pKa = 3.54EE84 pKa = 4.36NATQEE89 pKa = 4.13DD90 pKa = 4.96YY91 pKa = 11.18KK92 pKa = 11.48ALEE95 pKa = 4.34RR96 pKa = 11.84KK97 pKa = 10.2LNDD100 pKa = 3.62LKK102 pKa = 11.21ASYY105 pKa = 10.83YY106 pKa = 10.56SLSKK110 pKa = 10.98
Molecular weight: 12.54 kDa
Isoelectric point according different methods:
Protein with the highest isoelectric point:
>tr|A0A1W6JQI7|A0A1W6JQI7_STAAU Pathogenicity island protein OS=Staphylococcus aureus OX=1280 PE=4 SV=1
MM1 pKa = 7.47KK2 pKa = 10.27LSKK5 pKa = 10.48SKK7 pKa = 10.96NVLYY11 pKa = 10.52YY12 pKa = 10.9RR13 pKa = 11.84NVDD16 pKa = 3.42NKK18 pKa = 10.66LSEE21 pKa = 4.36YY22 pKa = 10.76QLLTQFNPAFINKK35 pKa = 8.6KK36 pKa = 9.68IKK38 pKa = 9.14MCEE41 pKa = 3.79FQIEE45 pKa = 4.63SMYY48 pKa = 11.07HH49 pKa = 4.98MSASTTTCDD58 pKa = 3.11EE59 pKa = 3.78IMGVVSVSYY68 pKa = 9.82PIEE71 pKa = 4.11KK72 pKa = 10.29LVIKK76 pKa = 10.38IIEE79 pKa = 4.41TKK81 pKa = 10.74AGLQTYY87 pKa = 10.16KK88 pKa = 10.63NRR90 pKa = 11.84SINNMALLKK99 pKa = 10.5KK100 pKa = 10.23VLNHH104 pKa = 5.01YY105 pKa = 7.29TEE107 pKa = 5.18KK108 pKa = 10.55EE109 pKa = 3.81QKK111 pKa = 10.14QVVKK115 pKa = 10.31YY116 pKa = 8.17MRR118 pKa = 11.84SNGRR122 pKa = 11.84YY123 pKa = 8.61KK124 pKa = 10.23PYY126 pKa = 10.97NVIEE130 pKa = 4.13RR131 pKa = 11.84LQVDD135 pKa = 5.23LYY137 pKa = 10.41QASIKK142 pKa = 9.94QRR144 pKa = 11.84SEE146 pKa = 3.63RR147 pKa = 11.84QKK149 pKa = 10.67QRR151 pKa = 11.84NTAIEE156 pKa = 3.83NSKK159 pKa = 9.63IARR162 pKa = 11.84VNAYY166 pKa = 9.01HH167 pKa = 6.0QSSYY171 pKa = 10.74VKK173 pKa = 10.67VVV175 pKa = 2.74
MM1 pKa = 7.47KK2 pKa = 10.27LSKK5 pKa = 10.48SKK7 pKa = 10.96NVLYY11 pKa = 10.52YY12 pKa = 10.9RR13 pKa = 11.84NVDD16 pKa = 3.42NKK18 pKa = 10.66LSEE21 pKa = 4.36YY22 pKa = 10.76QLLTQFNPAFINKK35 pKa = 8.6KK36 pKa = 9.68IKK38 pKa = 9.14MCEE41 pKa = 3.79FQIEE45 pKa = 4.63SMYY48 pKa = 11.07HH49 pKa = 4.98MSASTTTCDD58 pKa = 3.11EE59 pKa = 3.78IMGVVSVSYY68 pKa = 9.82PIEE71 pKa = 4.11KK72 pKa = 10.29LVIKK76 pKa = 10.38IIEE79 pKa = 4.41TKK81 pKa = 10.74AGLQTYY87 pKa = 10.16KK88 pKa = 10.63NRR90 pKa = 11.84SINNMALLKK99 pKa = 10.5KK100 pKa = 10.23VLNHH104 pKa = 5.01YY105 pKa = 7.29TEE107 pKa = 5.18KK108 pKa = 10.55EE109 pKa = 3.81QKK111 pKa = 10.14QVVKK115 pKa = 10.31YY116 pKa = 8.17MRR118 pKa = 11.84SNGRR122 pKa = 11.84YY123 pKa = 8.61KK124 pKa = 10.23PYY126 pKa = 10.97NVIEE130 pKa = 4.13RR131 pKa = 11.84LQVDD135 pKa = 5.23LYY137 pKa = 10.41QASIKK142 pKa = 9.94QRR144 pKa = 11.84SEE146 pKa = 3.63RR147 pKa = 11.84QKK149 pKa = 10.67QRR151 pKa = 11.84NTAIEE156 pKa = 3.83NSKK159 pKa = 9.63IARR162 pKa = 11.84VNAYY166 pKa = 9.01HH167 pKa = 6.0QSSYY171 pKa = 10.74VKK173 pKa = 10.67VVV175 pKa = 2.74
Molecular weight: 20.58 kDa
Isoelectric point according different methods:
Peptides (in silico digests for buttom-up proteomics)
Below you can find in silico digests of the whole proteome with Trypsin, Chymotrypsin, Trypsin+LysC, LysN, ArgC proteases suitable for different mass spec machines.| Try ESI |
 |
|---|
| ChTry ESI |
 |
|---|
| ArgC ESI |
 |
|---|
| LysN ESI |
 |
|---|
| TryLysC ESI |
 |
|---|
| Try MALDI |
 |
|---|
| ChTry MALDI |
 |
|---|
| ArgC MALDI |
 |
|---|
| LysN MALDI |
 |
|---|
| TryLysC MALDI |
 |
|---|
| Try LTQ |
 |
|---|
| ChTry LTQ |
 |
|---|
| ArgC LTQ |
 |
|---|
| LysN LTQ |
 |
|---|
| TryLysC LTQ |
 |
|---|
| Try MSlow |
 |
|---|
| ChTry MSlow |
 |
|---|
| ArgC MSlow |
 |
|---|
| LysN MSlow |
 |
|---|
| TryLysC MSlow |
 |
|---|
| Try MShigh |
 |
|---|
| ChTry MShigh |
 |
|---|
| ArgC MShigh |
 |
|---|
| LysN MShigh |
 |
|---|
| TryLysC MShigh |
 |
|---|
General Statistics
Number of major isoforms |
Number of additional isoforms |
Number of all proteins |
Number of amino acids |
Min. Seq. Length |
Max. Seq. Length |
Avg. Seq. Length |
Avg. Mol. Weight |
|---|---|---|---|---|---|---|---|
0 |
3279 |
58 |
489 |
163.9 |
19.06 |
Amino acid frequency
Ala |
Cys |
Asp |
Glu |
Phe |
Gly |
His |
Ile |
Lys |
Leu |
|---|---|---|---|---|---|---|---|---|---|
4.788 ± 0.384 | 0.823 ± 0.153 |
6.679 ± 0.521 | 8.387 ± 0.651 |
3.843 ± 0.425 | 4.056 ± 0.388 |
2.47 ± 0.219 | 7.777 ± 0.307 |
10.369 ± 0.59 | 7.838 ± 0.427 |
Met |
Asn |
Gln |
Pro |
Arg |
Ser |
Thr |
Val |
Trp |
Tyr |
|---|---|---|---|---|---|---|---|---|---|
2.287 ± 0.293 | 6.923 ± 0.64 |
2.196 ± 0.282 | 3.66 ± 0.358 |
3.904 ± 0.464 | 6.404 ± 0.529 |
5.306 ± 0.472 | 6.282 ± 0.457 |
1.037 ± 0.228 | 4.971 ± 0.362 |
Most of the basic statistics you can see at this page can be downloaded from this CSV file
Proteome-pI is available under Creative Commons Attribution-NoDerivs license, for more details see here
| Reference: Kozlowski LP. Proteome-pI 2.0: Proteome Isoelectric Point Database Update. Nucleic Acids Res. 2021, doi: 10.1093/nar/gkab944 | Contact: Lukasz P. Kozlowski |
