Methyloprofundus sedimenti
Taxonomy: cellular organisms; Bacteria; Proteobacteria; Gammaproteobacteria; Methylococcales; Methylococcaceae; Methyloprofundus
Average proteome isoelectric point is 6.39
Get precalculated fractions of proteins

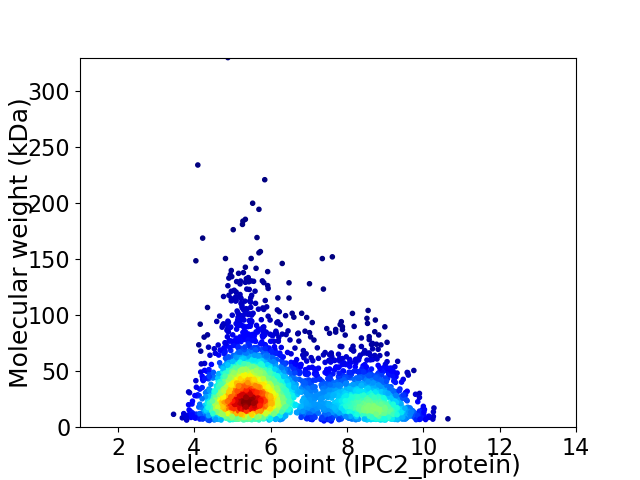
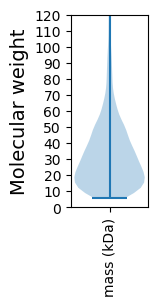
Virtual 2D-PAGE plot for 3608 proteins (isoelectric point calculated using IPC2_protein)
Get csv file with sequences according to given criteria:
* You can choose from 21 different methods for calculating isoelectric point
Summary statistics related to proteome-wise predictions


Protein with the lowest isoelectric point:
>tr|A0A1V8M7H1|A0A1V8M7H1_9GAMM 30S ribosomal protein S1 OS=Methyloprofundus sedimenti OX=1420851 GN=rpsA PE=3 SV=1
MM1 pKa = 7.36IVYY4 pKa = 8.07PKK6 pKa = 10.43QIDD9 pKa = 3.83GLEE12 pKa = 4.26PSPADD17 pKa = 4.03DD18 pKa = 4.09GFLIYY23 pKa = 10.34FQDD26 pKa = 3.74TDD28 pKa = 3.3RR29 pKa = 11.84VHH31 pKa = 6.2YY32 pKa = 9.83LNHH35 pKa = 6.49IATLVLLLCDD45 pKa = 4.15GKK47 pKa = 10.71NSNEE51 pKa = 4.94DD52 pKa = 3.22IPKK55 pKa = 10.39LLQQQYY61 pKa = 10.14DD62 pKa = 3.92LPEE65 pKa = 5.38APIDD69 pKa = 5.04DD70 pKa = 3.9VDD72 pKa = 3.79ALLNQFVDD80 pKa = 3.23EE81 pKa = 4.66GLIVLNVTTSAA92 pKa = 3.83
MM1 pKa = 7.36IVYY4 pKa = 8.07PKK6 pKa = 10.43QIDD9 pKa = 3.83GLEE12 pKa = 4.26PSPADD17 pKa = 4.03DD18 pKa = 4.09GFLIYY23 pKa = 10.34FQDD26 pKa = 3.74TDD28 pKa = 3.3RR29 pKa = 11.84VHH31 pKa = 6.2YY32 pKa = 9.83LNHH35 pKa = 6.49IATLVLLLCDD45 pKa = 4.15GKK47 pKa = 10.71NSNEE51 pKa = 4.94DD52 pKa = 3.22IPKK55 pKa = 10.39LLQQQYY61 pKa = 10.14DD62 pKa = 3.92LPEE65 pKa = 5.38APIDD69 pKa = 5.04DD70 pKa = 3.9VDD72 pKa = 3.79ALLNQFVDD80 pKa = 3.23EE81 pKa = 4.66GLIVLNVTTSAA92 pKa = 3.83
Molecular weight: 10.3 kDa
Isoelectric point according different methods:
Protein with the highest isoelectric point:
>tr|A0A1V8M6L9|A0A1V8M6L9_9GAMM Peptidoglycan D D-transpeptidase FtsI OS=Methyloprofundus sedimenti OX=1420851 GN=ftsI PE=3 SV=1
MM1 pKa = 7.63LLTVVVYY8 pKa = 9.0FRR10 pKa = 11.84GRR12 pKa = 11.84AKK14 pKa = 10.17RR15 pKa = 11.84RR16 pKa = 11.84EE17 pKa = 3.93AGRR20 pKa = 11.84PVSIGQTITFLLGMLCFVIALQSPLEE46 pKa = 4.07PLSEE50 pKa = 4.08HH51 pKa = 6.57FLFFHH56 pKa = 6.22QIEE59 pKa = 4.84HH60 pKa = 6.09ILMRR64 pKa = 11.84GLGPLLLILSMPLAPLLQGLPKK86 pKa = 9.99IIRR89 pKa = 11.84HH90 pKa = 5.27SVLTPIIRR98 pKa = 11.84NKK100 pKa = 8.65PVQWLYY106 pKa = 11.61KK107 pKa = 10.2FLGHH111 pKa = 6.72PAIASILFIATLLIWQIPSLHH132 pKa = 5.82NRR134 pKa = 11.84ALANQSLHH142 pKa = 5.07NWMHH146 pKa = 5.85FTMILTGFFFWWLICDD162 pKa = 3.68PRR164 pKa = 11.84QNTSRR169 pKa = 11.84IPFGMRR175 pKa = 11.84IVILWLVTIPNTIIGAMITLKK196 pKa = 10.32RR197 pKa = 11.84DD198 pKa = 3.44QIYY201 pKa = 10.47AAYY204 pKa = 9.97DD205 pKa = 3.46VLDD208 pKa = 3.72GRR210 pKa = 11.84LAIEE214 pKa = 4.8IMLDD218 pKa = 3.45QQLGGIMIWGPGGMMGLIGTAVVFFLWTRR247 pKa = 11.84KK248 pKa = 9.03DD249 pKa = 3.18RR250 pKa = 11.84KK251 pKa = 9.92LRR253 pKa = 11.84YY254 pKa = 9.54AKK256 pKa = 10.61
MM1 pKa = 7.63LLTVVVYY8 pKa = 9.0FRR10 pKa = 11.84GRR12 pKa = 11.84AKK14 pKa = 10.17RR15 pKa = 11.84RR16 pKa = 11.84EE17 pKa = 3.93AGRR20 pKa = 11.84PVSIGQTITFLLGMLCFVIALQSPLEE46 pKa = 4.07PLSEE50 pKa = 4.08HH51 pKa = 6.57FLFFHH56 pKa = 6.22QIEE59 pKa = 4.84HH60 pKa = 6.09ILMRR64 pKa = 11.84GLGPLLLILSMPLAPLLQGLPKK86 pKa = 9.99IIRR89 pKa = 11.84HH90 pKa = 5.27SVLTPIIRR98 pKa = 11.84NKK100 pKa = 8.65PVQWLYY106 pKa = 11.61KK107 pKa = 10.2FLGHH111 pKa = 6.72PAIASILFIATLLIWQIPSLHH132 pKa = 5.82NRR134 pKa = 11.84ALANQSLHH142 pKa = 5.07NWMHH146 pKa = 5.85FTMILTGFFFWWLICDD162 pKa = 3.68PRR164 pKa = 11.84QNTSRR169 pKa = 11.84IPFGMRR175 pKa = 11.84IVILWLVTIPNTIIGAMITLKK196 pKa = 10.32RR197 pKa = 11.84DD198 pKa = 3.44QIYY201 pKa = 10.47AAYY204 pKa = 9.97DD205 pKa = 3.46VLDD208 pKa = 3.72GRR210 pKa = 11.84LAIEE214 pKa = 4.8IMLDD218 pKa = 3.45QQLGGIMIWGPGGMMGLIGTAVVFFLWTRR247 pKa = 11.84KK248 pKa = 9.03DD249 pKa = 3.18RR250 pKa = 11.84KK251 pKa = 9.92LRR253 pKa = 11.84YY254 pKa = 9.54AKK256 pKa = 10.61
Molecular weight: 29.34 kDa
Isoelectric point according different methods:
Peptides (in silico digests for buttom-up proteomics)
Below you can find in silico digests of the whole proteome with Trypsin, Chymotrypsin, Trypsin+LysC, LysN, ArgC proteases suitable for different mass spec machines.| Try ESI |
 |
|---|
| ChTry ESI |
 |
|---|
| ArgC ESI |
 |
|---|
| LysN ESI |
 |
|---|
| TryLysC ESI |
 |
|---|
| Try MALDI |
 |
|---|
| ChTry MALDI |
 |
|---|
| ArgC MALDI |
 |
|---|
| LysN MALDI |
 |
|---|
| TryLysC MALDI |
 |
|---|
| Try LTQ |
 |
|---|
| ChTry LTQ |
 |
|---|
| ArgC LTQ |
 |
|---|
| LysN LTQ |
 |
|---|
| TryLysC LTQ |
 |
|---|
| Try MSlow |
 |
|---|
| ChTry MSlow |
 |
|---|
| ArgC MSlow |
 |
|---|
| LysN MSlow |
 |
|---|
| TryLysC MSlow |
 |
|---|
| Try MShigh |
 |
|---|
| ChTry MShigh |
 |
|---|
| ArgC MShigh |
 |
|---|
| LysN MShigh |
 |
|---|
| TryLysC MShigh |
 |
|---|
General Statistics
Number of major isoforms |
Number of additional isoforms |
Number of all proteins |
Number of amino acids |
Min. Seq. Length |
Max. Seq. Length |
Avg. Seq. Length |
Avg. Mol. Weight |
|---|---|---|---|---|---|---|---|
0 |
1120843 |
50 |
2923 |
310.7 |
34.69 |
Amino acid frequency
Ala |
Cys |
Asp |
Glu |
Phe |
Gly |
His |
Ile |
Lys |
Leu |
|---|---|---|---|---|---|---|---|---|---|
8.416 ± 0.042 | 1.133 ± 0.016 |
5.371 ± 0.027 | 5.955 ± 0.04 |
4.253 ± 0.028 | 6.51 ± 0.043 |
2.375 ± 0.024 | 7.282 ± 0.034 |
5.682 ± 0.047 | 10.633 ± 0.05 |
Met |
Asn |
Gln |
Pro |
Arg |
Ser |
Thr |
Val |
Trp |
Tyr |
|---|---|---|---|---|---|---|---|---|---|
2.471 ± 0.019 | 4.375 ± 0.029 |
3.958 ± 0.027 | 4.805 ± 0.037 |
4.451 ± 0.03 | 6.312 ± 0.032 |
5.177 ± 0.028 | 6.372 ± 0.037 |
1.256 ± 0.017 | 3.212 ± 0.022 |
Most of the basic statistics you can see at this page can be downloaded from this CSV file
Proteome-pI is available under Creative Commons Attribution-NoDerivs license, for more details see here
| Reference: Kozlowski LP. Proteome-pI 2.0: Proteome Isoelectric Point Database Update. Nucleic Acids Res. 2021, doi: 10.1093/nar/gkab944 | Contact: Lukasz P. Kozlowski |
