Tolypothrix campylonemoides VB511288
Taxonomy: cellular organisms; Bacteria; Terrabacteria group; Cyanobacteria/Melainabacteria group; Cyanobacteria; Nostocales; Tolypothrichaceae; Tolypothrix; Tolypothrix campylonemoides
Average proteome isoelectric point is 6.54
Get precalculated fractions of proteins

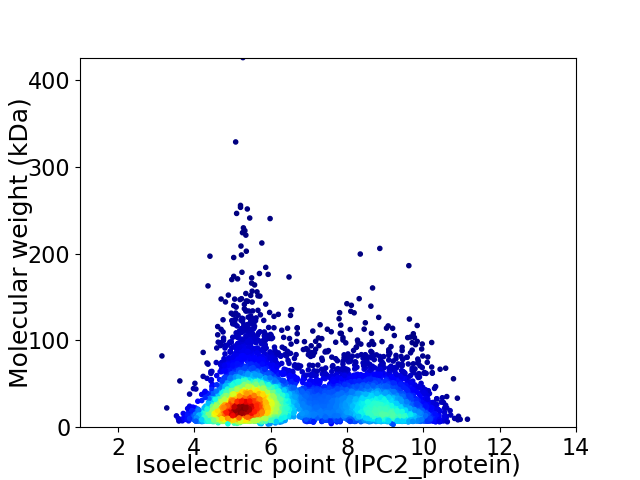
Virtual 2D-PAGE plot for 6864 proteins (isoelectric point calculated using IPC2_protein)
Get csv file with sequences according to given criteria:
* You can choose from 21 different methods for calculating isoelectric point
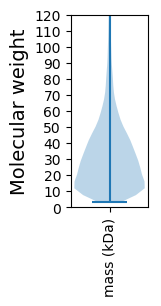
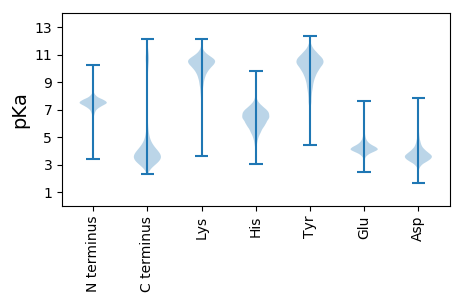
Summary statistics related to proteome-wise predictions


Protein with the lowest isoelectric point:
>tr|A0A0C2PPN7|A0A0C2PPN7_9CYAN Short-chain dehydrogenase OS=Tolypothrix campylonemoides VB511288 OX=1245935 GN=SD81_28825 PE=3 SV=1
MM1 pKa = 7.39QIQFRR6 pKa = 11.84EE7 pKa = 4.21INPFDD12 pKa = 3.26LWIWLEE18 pKa = 3.86FSTIPSEE25 pKa = 4.14QEE27 pKa = 3.28KK28 pKa = 10.76KK29 pKa = 10.33YY30 pKa = 10.85VEE32 pKa = 4.18EE33 pKa = 4.59VFNSWFYY40 pKa = 11.05LGKK43 pKa = 10.59LGAFNAEE50 pKa = 3.81NLQVQEE56 pKa = 4.22TGLDD60 pKa = 3.91LSYY63 pKa = 10.52MDD65 pKa = 5.37YY66 pKa = 11.24DD67 pKa = 3.56PEE69 pKa = 6.75GYY71 pKa = 10.18DD72 pKa = 3.44KK73 pKa = 11.36SLLALMHH80 pKa = 6.49NMGQFEE86 pKa = 4.9YY87 pKa = 9.84EE88 pKa = 4.39GTWARR93 pKa = 11.84CWFDD97 pKa = 4.77LGTSDD102 pKa = 6.2AIALDD107 pKa = 3.43ILINALKK114 pKa = 10.18QLNQEE119 pKa = 4.25YY120 pKa = 8.11VTIEE124 pKa = 3.51QLYY127 pKa = 10.33IGGEE131 pKa = 3.99NEE133 pKa = 3.95DD134 pKa = 3.51WSVEE138 pKa = 3.82DD139 pKa = 4.09SEE141 pKa = 4.69NGRR144 pKa = 11.84SSFIYY149 pKa = 10.68DD150 pKa = 3.23NN151 pKa = 3.84
MM1 pKa = 7.39QIQFRR6 pKa = 11.84EE7 pKa = 4.21INPFDD12 pKa = 3.26LWIWLEE18 pKa = 3.86FSTIPSEE25 pKa = 4.14QEE27 pKa = 3.28KK28 pKa = 10.76KK29 pKa = 10.33YY30 pKa = 10.85VEE32 pKa = 4.18EE33 pKa = 4.59VFNSWFYY40 pKa = 11.05LGKK43 pKa = 10.59LGAFNAEE50 pKa = 3.81NLQVQEE56 pKa = 4.22TGLDD60 pKa = 3.91LSYY63 pKa = 10.52MDD65 pKa = 5.37YY66 pKa = 11.24DD67 pKa = 3.56PEE69 pKa = 6.75GYY71 pKa = 10.18DD72 pKa = 3.44KK73 pKa = 11.36SLLALMHH80 pKa = 6.49NMGQFEE86 pKa = 4.9YY87 pKa = 9.84EE88 pKa = 4.39GTWARR93 pKa = 11.84CWFDD97 pKa = 4.77LGTSDD102 pKa = 6.2AIALDD107 pKa = 3.43ILINALKK114 pKa = 10.18QLNQEE119 pKa = 4.25YY120 pKa = 8.11VTIEE124 pKa = 3.51QLYY127 pKa = 10.33IGGEE131 pKa = 3.99NEE133 pKa = 3.95DD134 pKa = 3.51WSVEE138 pKa = 3.82DD139 pKa = 4.09SEE141 pKa = 4.69NGRR144 pKa = 11.84SSFIYY149 pKa = 10.68DD150 pKa = 3.23NN151 pKa = 3.84
Molecular weight: 17.73 kDa
Isoelectric point according different methods:
Protein with the highest isoelectric point:
>tr|A0A0C2L8C7|A0A0C2L8C7_9CYAN Enoyl-CoA hydratase OS=Tolypothrix campylonemoides VB511288 OX=1245935 GN=SD81_43775 PE=4 SV=1
MM1 pKa = 7.0ATTWQMHH8 pKa = 5.66RR9 pKa = 11.84ARR11 pKa = 11.84PVKK14 pKa = 10.16VHH16 pKa = 6.56GGAASPAARR25 pKa = 11.84EE26 pKa = 3.81GHH28 pKa = 5.15RR29 pKa = 11.84RR30 pKa = 11.84GRR32 pKa = 11.84GIHH35 pKa = 6.41AFAGMTAGTRR45 pKa = 11.84QRR47 pKa = 11.84GRR49 pKa = 11.84ARR51 pKa = 11.84SRR53 pKa = 11.84PRR55 pKa = 11.84RR56 pKa = 11.84TGAAAARR63 pKa = 11.84SRR65 pKa = 11.84RR66 pKa = 11.84IGRR69 pKa = 11.84KK70 pKa = 8.1RR71 pKa = 11.84LAWLRR76 pKa = 11.84IPHH79 pKa = 6.44HH80 pKa = 6.71LGPP83 pKa = 4.72
MM1 pKa = 7.0ATTWQMHH8 pKa = 5.66RR9 pKa = 11.84ARR11 pKa = 11.84PVKK14 pKa = 10.16VHH16 pKa = 6.56GGAASPAARR25 pKa = 11.84EE26 pKa = 3.81GHH28 pKa = 5.15RR29 pKa = 11.84RR30 pKa = 11.84GRR32 pKa = 11.84GIHH35 pKa = 6.41AFAGMTAGTRR45 pKa = 11.84QRR47 pKa = 11.84GRR49 pKa = 11.84ARR51 pKa = 11.84SRR53 pKa = 11.84PRR55 pKa = 11.84RR56 pKa = 11.84TGAAAARR63 pKa = 11.84SRR65 pKa = 11.84RR66 pKa = 11.84IGRR69 pKa = 11.84KK70 pKa = 8.1RR71 pKa = 11.84LAWLRR76 pKa = 11.84IPHH79 pKa = 6.44HH80 pKa = 6.71LGPP83 pKa = 4.72
Molecular weight: 9.19 kDa
Isoelectric point according different methods:
Peptides (in silico digests for buttom-up proteomics)
Below you can find in silico digests of the whole proteome with Trypsin, Chymotrypsin, Trypsin+LysC, LysN, ArgC proteases suitable for different mass spec machines.| Try ESI |
 |
|---|
| ChTry ESI |
 |
|---|
| ArgC ESI |
 |
|---|
| LysN ESI |
 |
|---|
| TryLysC ESI |
 |
|---|
| Try MALDI |
 |
|---|
| ChTry MALDI |
 |
|---|
| ArgC MALDI |
 |
|---|
| LysN MALDI |
 |
|---|
| TryLysC MALDI |
 |
|---|
| Try LTQ |
 |
|---|
| ChTry LTQ |
 |
|---|
| ArgC LTQ |
 |
|---|
| LysN LTQ |
 |
|---|
| TryLysC LTQ |
 |
|---|
| Try MSlow |
 |
|---|
| ChTry MSlow |
 |
|---|
| ArgC MSlow |
 |
|---|
| LysN MSlow |
 |
|---|
| TryLysC MSlow |
 |
|---|
| Try MShigh |
 |
|---|
| ChTry MShigh |
 |
|---|
| ArgC MShigh |
 |
|---|
| LysN MShigh |
 |
|---|
| TryLysC MShigh |
 |
|---|
General Statistics
Number of major isoforms |
Number of additional isoforms |
Number of all proteins |
Number of amino acids |
Min. Seq. Length |
Max. Seq. Length |
Avg. Seq. Length |
Avg. Mol. Weight |
|---|---|---|---|---|---|---|---|
2116098 |
30 |
3801 |
308.3 |
34.32 |
Amino acid frequency
Ala |
Cys |
Asp |
Glu |
Phe |
Gly |
His |
Ile |
Lys |
Leu |
|---|---|---|---|---|---|---|---|---|---|
8.782 ± 0.049 | 0.981 ± 0.01 |
4.876 ± 0.023 | 6.348 ± 0.031 |
3.796 ± 0.021 | 6.892 ± 0.035 |
2.078 ± 0.021 | 6.071 ± 0.031 |
4.657 ± 0.03 | 10.753 ± 0.036 |
Met |
Asn |
Gln |
Pro |
Arg |
Ser |
Thr |
Val |
Trp |
Tyr |
|---|---|---|---|---|---|---|---|---|---|
1.784 ± 0.014 | 3.94 ± 0.026 |
4.757 ± 0.023 | 5.367 ± 0.03 |
6.03 ± 0.054 | 6.09 ± 0.03 |
5.396 ± 0.028 | 7.154 ± 0.025 |
1.37 ± 0.013 | 2.876 ± 0.019 |
Most of the basic statistics you can see at this page can be downloaded from this CSV file
Proteome-pI is available under Creative Commons Attribution-NoDerivs license, for more details see here
| Reference: Kozlowski LP. Proteome-pI 2.0: Proteome Isoelectric Point Database Update. Nucleic Acids Res. 2021, doi: 10.1093/nar/gkab944 | Contact: Lukasz P. Kozlowski |
