Perkinsela sp. CCAP 1560/4
Taxonomy: cellular organisms; Eukaryota; Discoba; Euglenozoa; Kinetoplastea; Prokinetoplastina; Ichthyobodonidae; Perkinsela; unclassified Perkinsela
Average proteome isoelectric point is 7.01
Get precalculated fractions of proteins

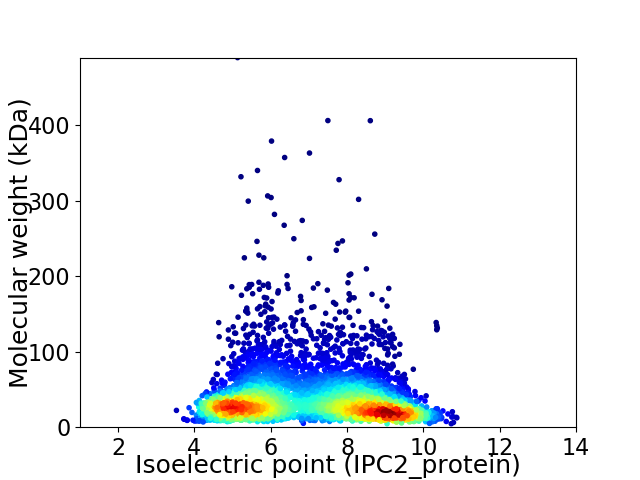
Virtual 2D-PAGE plot for 4883 proteins (isoelectric point calculated using IPC2_protein)
Get csv file with sequences according to given criteria:
* You can choose from 21 different methods for calculating isoelectric point
Summary statistics related to proteome-wise predictions


Protein with the lowest isoelectric point:
>tr|A0A0L1KSU0|A0A0L1KSU0_9EUGL Developmentally regulated GTP-binding protein OS=Perkinsela sp. CCAP 1560/4 OX=1314962 GN=XU18_2431 PE=4 SV=1
MM1 pKa = 7.38YY2 pKa = 10.36SIDD5 pKa = 3.62PDD7 pKa = 4.23GIARR11 pKa = 11.84VEE13 pKa = 4.04PSVMDD18 pKa = 3.95DD19 pKa = 3.27QTLLEE24 pKa = 4.18LVVVGFDD31 pKa = 3.33GVEE34 pKa = 4.05VFQSSNGDD42 pKa = 3.21FLDD45 pKa = 3.05IHH47 pKa = 6.58RR48 pKa = 11.84WDD50 pKa = 3.63GVTVDD55 pKa = 3.58SAQNIHH61 pKa = 6.87SITFCGTEE69 pKa = 3.84DD70 pKa = 4.24RR71 pKa = 11.84LLDD74 pKa = 4.45SYY76 pKa = 12.07DD77 pKa = 3.9DD78 pKa = 4.58DD79 pKa = 4.96YY80 pKa = 11.81EE81 pKa = 5.34GNVEE85 pKa = 4.12PGGTIHH91 pKa = 7.69LDD93 pKa = 3.07WLPTHH98 pKa = 7.07IAA100 pKa = 3.41
MM1 pKa = 7.38YY2 pKa = 10.36SIDD5 pKa = 3.62PDD7 pKa = 4.23GIARR11 pKa = 11.84VEE13 pKa = 4.04PSVMDD18 pKa = 3.95DD19 pKa = 3.27QTLLEE24 pKa = 4.18LVVVGFDD31 pKa = 3.33GVEE34 pKa = 4.05VFQSSNGDD42 pKa = 3.21FLDD45 pKa = 3.05IHH47 pKa = 6.58RR48 pKa = 11.84WDD50 pKa = 3.63GVTVDD55 pKa = 3.58SAQNIHH61 pKa = 6.87SITFCGTEE69 pKa = 3.84DD70 pKa = 4.24RR71 pKa = 11.84LLDD74 pKa = 4.45SYY76 pKa = 12.07DD77 pKa = 3.9DD78 pKa = 4.58DD79 pKa = 4.96YY80 pKa = 11.81EE81 pKa = 5.34GNVEE85 pKa = 4.12PGGTIHH91 pKa = 7.69LDD93 pKa = 3.07WLPTHH98 pKa = 7.07IAA100 pKa = 3.41
Molecular weight: 11.1 kDa
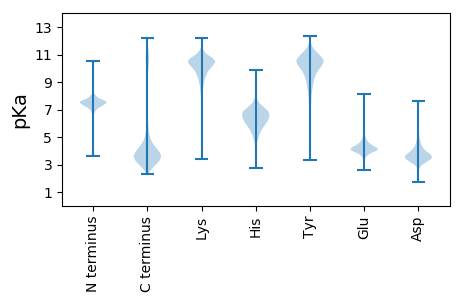
Isoelectric point according different methods:
Protein with the highest isoelectric point:
>tr|A0A0L1KX96|A0A0L1KX96_9EUGL Uncharacterized protein (Fragment) OS=Perkinsela sp. CCAP 1560/4 OX=1314962 GN=XU18_0878 PE=4 SV=1
MM1 pKa = 8.0IEE3 pKa = 4.0VNEE6 pKa = 4.24TRR8 pKa = 11.84LKK10 pKa = 10.0VHH12 pKa = 6.34LNCRR16 pKa = 11.84IFSTGGGHH24 pKa = 5.72STTAINEE31 pKa = 4.04PPRR34 pKa = 11.84QIMEE38 pKa = 4.21EE39 pKa = 3.96LLQVLLHH46 pKa = 5.34SARR49 pKa = 11.84LRR51 pKa = 11.84FSGLLRR57 pKa = 11.84SRR59 pKa = 11.84QPANFVNPRR68 pKa = 11.84KK69 pKa = 10.4YY70 pKa = 10.31IVWCQFTQQGANPLRR85 pKa = 11.84RR86 pKa = 11.84GFHH89 pKa = 6.64DD90 pKa = 3.03RR91 pKa = 11.84WNPAEE96 pKa = 4.12LNRR99 pKa = 11.84LSWHH103 pKa = 6.04VRR105 pKa = 11.84SQHH108 pKa = 6.96LILKK112 pKa = 7.24YY113 pKa = 9.98SCIYY117 pKa = 10.65SLLEE121 pKa = 3.75HH122 pKa = 6.9AMFAAKK128 pKa = 10.2AGNAKK133 pKa = 10.26
MM1 pKa = 8.0IEE3 pKa = 4.0VNEE6 pKa = 4.24TRR8 pKa = 11.84LKK10 pKa = 10.0VHH12 pKa = 6.34LNCRR16 pKa = 11.84IFSTGGGHH24 pKa = 5.72STTAINEE31 pKa = 4.04PPRR34 pKa = 11.84QIMEE38 pKa = 4.21EE39 pKa = 3.96LLQVLLHH46 pKa = 5.34SARR49 pKa = 11.84LRR51 pKa = 11.84FSGLLRR57 pKa = 11.84SRR59 pKa = 11.84QPANFVNPRR68 pKa = 11.84KK69 pKa = 10.4YY70 pKa = 10.31IVWCQFTQQGANPLRR85 pKa = 11.84RR86 pKa = 11.84GFHH89 pKa = 6.64DD90 pKa = 3.03RR91 pKa = 11.84WNPAEE96 pKa = 4.12LNRR99 pKa = 11.84LSWHH103 pKa = 6.04VRR105 pKa = 11.84SQHH108 pKa = 6.96LILKK112 pKa = 7.24YY113 pKa = 9.98SCIYY117 pKa = 10.65SLLEE121 pKa = 3.75HH122 pKa = 6.9AMFAAKK128 pKa = 10.2AGNAKK133 pKa = 10.26
Molecular weight: 15.41 kDa
Isoelectric point according different methods:
Peptides (in silico digests for buttom-up proteomics)
Below you can find in silico digests of the whole proteome with Trypsin, Chymotrypsin, Trypsin+LysC, LysN, ArgC proteases suitable for different mass spec machines.| Try ESI |
 |
|---|
| ChTry ESI |
 |
|---|
| ArgC ESI |
 |
|---|
| LysN ESI |
 |
|---|
| TryLysC ESI |
 |
|---|
| Try MALDI |
 |
|---|
| ChTry MALDI |
 |
|---|
| ArgC MALDI |
 |
|---|
| LysN MALDI |
 |
|---|
| TryLysC MALDI |
 |
|---|
| Try LTQ |
 |
|---|
| ChTry LTQ |
 |
|---|
| ArgC LTQ |
 |
|---|
| LysN LTQ |
 |
|---|
| TryLysC LTQ |
 |
|---|
| Try MSlow |
 |
|---|
| ChTry MSlow |
 |
|---|
| ArgC MSlow |
 |
|---|
| LysN MSlow |
 |
|---|
| TryLysC MSlow |
 |
|---|
| Try MShigh |
 |
|---|
| ChTry MShigh |
 |
|---|
| ArgC MShigh |
 |
|---|
| LysN MShigh |
 |
|---|
| TryLysC MShigh |
 |
|---|
General Statistics
Number of major isoforms |
Number of additional isoforms |
Number of all proteins |
Number of amino acids |
Min. Seq. Length |
Max. Seq. Length |
Avg. Seq. Length |
Avg. Mol. Weight |
|---|---|---|---|---|---|---|---|
0 |
1753898 |
38 |
4342 |
359.2 |
40.49 |
Amino acid frequency
Ala |
Cys |
Asp |
Glu |
Phe |
Gly |
His |
Ile |
Lys |
Leu |
|---|---|---|---|---|---|---|---|---|---|
6.886 ± 0.033 | 2.145 ± 0.02 |
5.108 ± 0.022 | 6.391 ± 0.033 |
4.413 ± 0.024 | 5.425 ± 0.031 |
2.954 ± 0.016 | 5.601 ± 0.027 |
5.655 ± 0.032 | 9.985 ± 0.039 |
Met |
Asn |
Gln |
Pro |
Arg |
Ser |
Thr |
Val |
Trp |
Tyr |
|---|---|---|---|---|---|---|---|---|---|
2.41 ± 0.014 | 4.073 ± 0.022 |
4.605 ± 0.027 | 3.896 ± 0.021 |
6.299 ± 0.032 | 8.565 ± 0.034 |
5.533 ± 0.021 | 6.117 ± 0.019 |
1.167 ± 0.011 | 2.768 ± 0.019 |
Most of the basic statistics you can see at this page can be downloaded from this CSV file
Proteome-pI is available under Creative Commons Attribution-NoDerivs license, for more details see here
| Reference: Kozlowski LP. Proteome-pI 2.0: Proteome Isoelectric Point Database Update. Nucleic Acids Res. 2021, doi: 10.1093/nar/gkab944 | Contact: Lukasz P. Kozlowski |
