Prosthecomicrobium hirschii
Taxonomy: cellular organisms; Bacteria; Proteobacteria; Alphaproteobacteria; Hyphomicrobiales; Hyphomicrobiaceae; Prosthecomicrobium
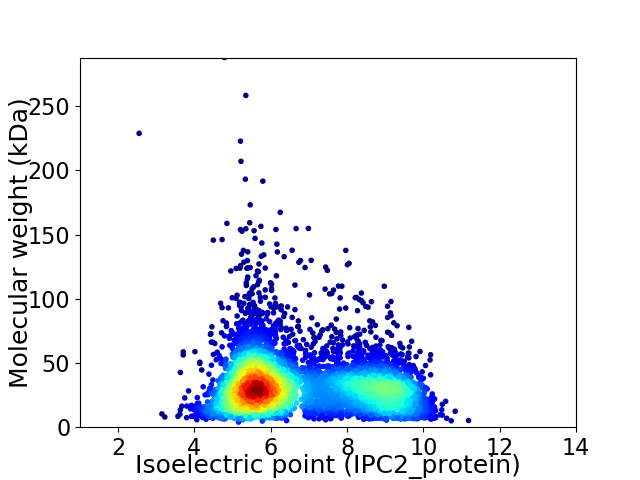
Average proteome isoelectric point is 6.77
Get precalculated fractions of proteins

Virtual 2D-PAGE plot for 5501 proteins (isoelectric point calculated using IPC2_protein)
Get csv file with sequences according to given criteria:
* You can choose from 21 different methods for calculating isoelectric point
Summary statistics related to proteome-wise predictions


Protein with the lowest isoelectric point:
>tr|A0A0P6W3F8|A0A0P6W3F8_9RHIZ Sulfite dehydrogenase OS=Prosthecomicrobium hirschii OX=665126 GN=ABB55_17035 PE=4 SV=1
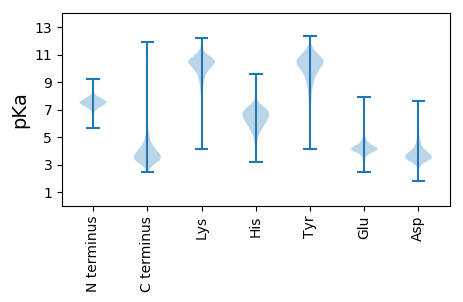
MM1 pKa = 7.28SLSGAINSAVSALRR15 pKa = 11.84AQSQALAVTSDD26 pKa = 3.57NIANAEE32 pKa = 4.16TYY34 pKa = 10.21GYY36 pKa = 7.76KK37 pKa = 9.91TSASFFEE44 pKa = 4.48SLVTSSGSTVTGSYY58 pKa = 10.31SAGGVQAATRR68 pKa = 11.84SNVTSSGLLEE78 pKa = 4.22STSNSTDD85 pKa = 3.43LAIDD89 pKa = 3.64GQGFFVVSAGDD100 pKa = 3.79GTDD103 pKa = 2.89TLYY106 pKa = 9.68YY107 pKa = 8.78TRR109 pKa = 11.84NGAFTVNTDD118 pKa = 4.28GEE120 pKa = 4.61LTNNGYY126 pKa = 7.74TLLGWPTDD134 pKa = 3.36ADD136 pKa = 3.84GTVTGGTNTEE146 pKa = 4.04NLTPIDD152 pKa = 3.74IDD154 pKa = 4.42SIASSASATTEE165 pKa = 3.65ASVVANLPANAEE177 pKa = 4.17TGDD180 pKa = 4.08TFTSTMDD187 pKa = 3.86LYY189 pKa = 11.42DD190 pKa = 3.76SLGTPAQSTMTWTKK204 pKa = 9.81TGEE207 pKa = 4.41NTWSLAFSDD216 pKa = 4.16PTASGSDD223 pKa = 3.13SATAIGTVSSSAITVTFNGDD243 pKa = 2.79GTLASTSPSPPTLTVSGWTSGAADD267 pKa = 3.47SSITLDD273 pKa = 3.58LGTAGSANGLSQYY286 pKa = 9.66TSSASTLTVSPTISQDD302 pKa = 2.82GKK304 pKa = 10.11PYY306 pKa = 9.43GTLSSIAVADD316 pKa = 4.55DD317 pKa = 3.58GTVNATYY324 pKa = 11.15SNGQTRR330 pKa = 11.84SIFKK334 pKa = 10.43IPVATFTNANGLEE347 pKa = 4.08AMSGAVYY354 pKa = 10.29RR355 pKa = 11.84VTDD358 pKa = 3.67EE359 pKa = 4.56SGASTLHH366 pKa = 6.64LAGADD371 pKa = 3.58GAGTVQGSTLEE382 pKa = 4.22ASTTDD387 pKa = 3.23TNEE390 pKa = 3.67QFSNMIAAQQAYY402 pKa = 9.24SAASKK407 pKa = 11.04VMSTANDD414 pKa = 3.41MFQTLLQVVSS424 pKa = 3.92
MM1 pKa = 7.28SLSGAINSAVSALRR15 pKa = 11.84AQSQALAVTSDD26 pKa = 3.57NIANAEE32 pKa = 4.16TYY34 pKa = 10.21GYY36 pKa = 7.76KK37 pKa = 9.91TSASFFEE44 pKa = 4.48SLVTSSGSTVTGSYY58 pKa = 10.31SAGGVQAATRR68 pKa = 11.84SNVTSSGLLEE78 pKa = 4.22STSNSTDD85 pKa = 3.43LAIDD89 pKa = 3.64GQGFFVVSAGDD100 pKa = 3.79GTDD103 pKa = 2.89TLYY106 pKa = 9.68YY107 pKa = 8.78TRR109 pKa = 11.84NGAFTVNTDD118 pKa = 4.28GEE120 pKa = 4.61LTNNGYY126 pKa = 7.74TLLGWPTDD134 pKa = 3.36ADD136 pKa = 3.84GTVTGGTNTEE146 pKa = 4.04NLTPIDD152 pKa = 3.74IDD154 pKa = 4.42SIASSASATTEE165 pKa = 3.65ASVVANLPANAEE177 pKa = 4.17TGDD180 pKa = 4.08TFTSTMDD187 pKa = 3.86LYY189 pKa = 11.42DD190 pKa = 3.76SLGTPAQSTMTWTKK204 pKa = 9.81TGEE207 pKa = 4.41NTWSLAFSDD216 pKa = 4.16PTASGSDD223 pKa = 3.13SATAIGTVSSSAITVTFNGDD243 pKa = 2.79GTLASTSPSPPTLTVSGWTSGAADD267 pKa = 3.47SSITLDD273 pKa = 3.58LGTAGSANGLSQYY286 pKa = 9.66TSSASTLTVSPTISQDD302 pKa = 2.82GKK304 pKa = 10.11PYY306 pKa = 9.43GTLSSIAVADD316 pKa = 4.55DD317 pKa = 3.58GTVNATYY324 pKa = 11.15SNGQTRR330 pKa = 11.84SIFKK334 pKa = 10.43IPVATFTNANGLEE347 pKa = 4.08AMSGAVYY354 pKa = 10.29RR355 pKa = 11.84VTDD358 pKa = 3.67EE359 pKa = 4.56SGASTLHH366 pKa = 6.64LAGADD371 pKa = 3.58GAGTVQGSTLEE382 pKa = 4.22ASTTDD387 pKa = 3.23TNEE390 pKa = 3.67QFSNMIAAQQAYY402 pKa = 9.24SAASKK407 pKa = 11.04VMSTANDD414 pKa = 3.41MFQTLLQVVSS424 pKa = 3.92
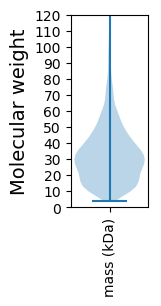
Molecular weight: 42.66 kDa
Isoelectric point according different methods:
Protein with the highest isoelectric point:
>tr|A0A0P6W460|A0A0P6W460_9RHIZ Peptidase C51 domain-containing protein OS=Prosthecomicrobium hirschii OX=665126 GN=ABB55_14150 PE=4 SV=1
MM1 pKa = 7.35KK2 pKa = 9.43RR3 pKa = 11.84TYY5 pKa = 10.27QPSKK9 pKa = 9.73LVRR12 pKa = 11.84KK13 pKa = 9.15RR14 pKa = 11.84RR15 pKa = 11.84HH16 pKa = 4.42GFRR19 pKa = 11.84ARR21 pKa = 11.84MATVGGRR28 pKa = 11.84LVIARR33 pKa = 11.84RR34 pKa = 11.84RR35 pKa = 11.84ARR37 pKa = 11.84GRR39 pKa = 11.84KK40 pKa = 8.98RR41 pKa = 11.84LSAA44 pKa = 4.03
MM1 pKa = 7.35KK2 pKa = 9.43RR3 pKa = 11.84TYY5 pKa = 10.27QPSKK9 pKa = 9.73LVRR12 pKa = 11.84KK13 pKa = 9.15RR14 pKa = 11.84RR15 pKa = 11.84HH16 pKa = 4.42GFRR19 pKa = 11.84ARR21 pKa = 11.84MATVGGRR28 pKa = 11.84LVIARR33 pKa = 11.84RR34 pKa = 11.84RR35 pKa = 11.84ARR37 pKa = 11.84GRR39 pKa = 11.84KK40 pKa = 8.98RR41 pKa = 11.84LSAA44 pKa = 4.03
Molecular weight: 5.21 kDa
Isoelectric point according different methods:
Peptides (in silico digests for buttom-up proteomics)
Below you can find in silico digests of the whole proteome with Trypsin, Chymotrypsin, Trypsin+LysC, LysN, ArgC proteases suitable for different mass spec machines.| Try ESI |
 |
|---|
| ChTry ESI |
 |
|---|
| ArgC ESI |
 |
|---|
| LysN ESI |
 |
|---|
| TryLysC ESI |
 |
|---|
| Try MALDI |
 |
|---|
| ChTry MALDI |
 |
|---|
| ArgC MALDI |
 |
|---|
| LysN MALDI |
 |
|---|
| TryLysC MALDI |
 |
|---|
| Try LTQ |
 |
|---|
| ChTry LTQ |
 |
|---|
| ArgC LTQ |
 |
|---|
| LysN LTQ |
 |
|---|
| TryLysC LTQ |
 |
|---|
| Try MSlow |
 |
|---|
| ChTry MSlow |
 |
|---|
| ArgC MSlow |
 |
|---|
| LysN MSlow |
 |
|---|
| TryLysC MSlow |
 |
|---|
| Try MShigh |
 |
|---|
| ChTry MShigh |
 |
|---|
| ArgC MShigh |
 |
|---|
| LysN MShigh |
 |
|---|
| TryLysC MShigh |
 |
|---|
General Statistics
Number of major isoforms |
Number of additional isoforms |
Number of all proteins |
Number of amino acids |
Min. Seq. Length |
Max. Seq. Length |
Avg. Seq. Length |
Avg. Mol. Weight |
|---|---|---|---|---|---|---|---|
0 |
1765156 |
35 |
2688 |
320.9 |
34.45 |
Amino acid frequency
Ala |
Cys |
Asp |
Glu |
Phe |
Gly |
His |
Ile |
Lys |
Leu |
|---|---|---|---|---|---|---|---|---|---|
14.196 ± 0.058 | 0.762 ± 0.01 |
5.755 ± 0.03 | 5.322 ± 0.035 |
3.589 ± 0.021 | 9.137 ± 0.043 |
1.874 ± 0.016 | 4.924 ± 0.023 |
2.767 ± 0.028 | 10.054 ± 0.038 |
Met |
Asn |
Gln |
Pro |
Arg |
Ser |
Thr |
Val |
Trp |
Tyr |
|---|---|---|---|---|---|---|---|---|---|
2.296 ± 0.014 | 2.099 ± 0.02 |
5.625 ± 0.03 | 2.572 ± 0.022 |
7.813 ± 0.042 | 4.75 ± 0.022 |
5.308 ± 0.033 | 7.829 ± 0.024 |
1.314 ± 0.012 | 2.013 ± 0.017 |
Most of the basic statistics you can see at this page can be downloaded from this CSV file
Proteome-pI is available under Creative Commons Attribution-NoDerivs license, for more details see here
| Reference: Kozlowski LP. Proteome-pI 2.0: Proteome Isoelectric Point Database Update. Nucleic Acids Res. 2021, doi: 10.1093/nar/gkab944 | Contact: Lukasz P. Kozlowski |
