Mycoplasma citelli
Taxonomy: cellular organisms; Bacteria; Terrabacteria group; Tenericutes; Mollicutes; Mycoplasmatales; Mycoplasmataceae; Mycoplasmopsis
Average proteome isoelectric point is 7.46
Get precalculated fractions of proteins

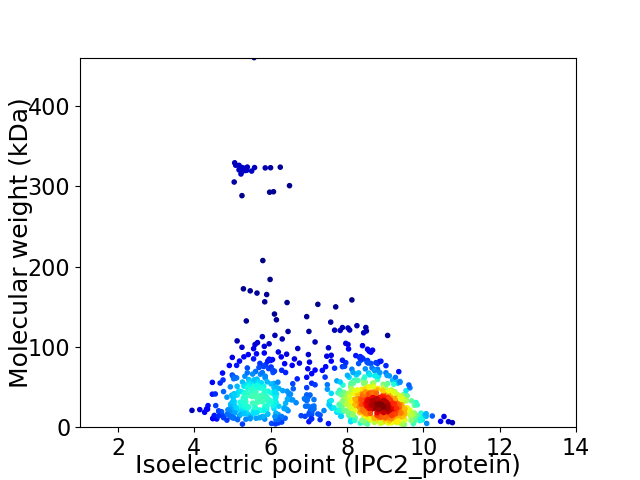
Virtual 2D-PAGE plot for 908 proteins (isoelectric point calculated using IPC2_protein)
Get csv file with sequences according to given criteria:
* You can choose from 21 different methods for calculating isoelectric point
Summary statistics related to proteome-wise predictions


Protein with the lowest isoelectric point:
>tr|A0A449B2R3|A0A449B2R3_9MOLU Uracil-DNA glycosylase OS=Mycoplasma citelli OX=171281 GN=ung PE=3 SV=1
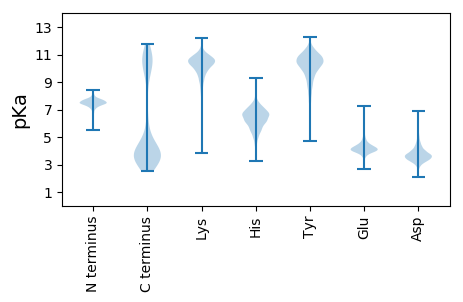
MM1 pKa = 6.88NTILIQSQGTKK12 pKa = 10.07NLAYY16 pKa = 10.28VQEE19 pKa = 4.34KK20 pKa = 10.66VDD22 pKa = 4.2FNVKK26 pKa = 10.48DD27 pKa = 4.06FLSKK31 pKa = 10.99LDD33 pKa = 3.9MEE35 pKa = 4.99IKK37 pKa = 9.4TLSIEE42 pKa = 4.02EE43 pKa = 3.97QKK45 pKa = 11.31DD46 pKa = 3.79YY47 pKa = 11.11ISKK50 pKa = 10.61CEE52 pKa = 3.6YY53 pKa = 10.01LINYY57 pKa = 7.73KK58 pKa = 10.27FQDD61 pKa = 3.68PNQGVLVFQILDD73 pKa = 3.49LDD75 pKa = 3.81YY76 pKa = 11.26SYY78 pKa = 12.02DD79 pKa = 3.77NLTEE83 pKa = 3.81IYY85 pKa = 10.27YY86 pKa = 10.14ILDD89 pKa = 3.5EE90 pKa = 4.76EE91 pKa = 4.64FDD93 pKa = 3.79DD94 pKa = 4.0TRR96 pKa = 11.84TFSSFSEE103 pKa = 4.0NNPDD107 pKa = 4.16IKK109 pKa = 10.81AGCDD113 pKa = 2.85WYY115 pKa = 10.09DD116 pKa = 3.5TLDD119 pKa = 4.26KK120 pKa = 11.03SLQEE124 pKa = 4.21YY125 pKa = 10.32GLQSKK130 pKa = 9.26YY131 pKa = 11.08AYY133 pKa = 7.8LTNEE137 pKa = 3.68ILEE140 pKa = 4.25LQGDD144 pKa = 3.82KK145 pKa = 10.92NYY147 pKa = 10.81YY148 pKa = 9.94FLPDD152 pKa = 3.45YY153 pKa = 10.69DD154 pKa = 4.65SPLKK158 pKa = 10.68ALSSTEE164 pKa = 4.28LINLIFTFMLNLKK177 pKa = 8.37QQNQQFKK184 pKa = 9.8EE185 pKa = 4.04
MM1 pKa = 6.88NTILIQSQGTKK12 pKa = 10.07NLAYY16 pKa = 10.28VQEE19 pKa = 4.34KK20 pKa = 10.66VDD22 pKa = 4.2FNVKK26 pKa = 10.48DD27 pKa = 4.06FLSKK31 pKa = 10.99LDD33 pKa = 3.9MEE35 pKa = 4.99IKK37 pKa = 9.4TLSIEE42 pKa = 4.02EE43 pKa = 3.97QKK45 pKa = 11.31DD46 pKa = 3.79YY47 pKa = 11.11ISKK50 pKa = 10.61CEE52 pKa = 3.6YY53 pKa = 10.01LINYY57 pKa = 7.73KK58 pKa = 10.27FQDD61 pKa = 3.68PNQGVLVFQILDD73 pKa = 3.49LDD75 pKa = 3.81YY76 pKa = 11.26SYY78 pKa = 12.02DD79 pKa = 3.77NLTEE83 pKa = 3.81IYY85 pKa = 10.27YY86 pKa = 10.14ILDD89 pKa = 3.5EE90 pKa = 4.76EE91 pKa = 4.64FDD93 pKa = 3.79DD94 pKa = 4.0TRR96 pKa = 11.84TFSSFSEE103 pKa = 4.0NNPDD107 pKa = 4.16IKK109 pKa = 10.81AGCDD113 pKa = 2.85WYY115 pKa = 10.09DD116 pKa = 3.5TLDD119 pKa = 4.26KK120 pKa = 11.03SLQEE124 pKa = 4.21YY125 pKa = 10.32GLQSKK130 pKa = 9.26YY131 pKa = 11.08AYY133 pKa = 7.8LTNEE137 pKa = 3.68ILEE140 pKa = 4.25LQGDD144 pKa = 3.82KK145 pKa = 10.92NYY147 pKa = 10.81YY148 pKa = 9.94FLPDD152 pKa = 3.45YY153 pKa = 10.69DD154 pKa = 4.65SPLKK158 pKa = 10.68ALSSTEE164 pKa = 4.28LINLIFTFMLNLKK177 pKa = 8.37QQNQQFKK184 pKa = 9.8EE185 pKa = 4.04
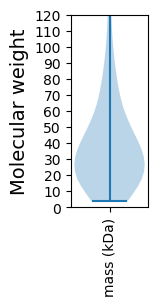
Molecular weight: 21.89 kDa
Isoelectric point according different methods:
Protein with the highest isoelectric point:
>tr|A0A449B2B3|A0A449B2B3_9MOLU Uncharacterized protein OS=Mycoplasma citelli OX=171281 GN=NCTC10181_00592 PE=4 SV=1
MM1 pKa = 7.07FVSNKK6 pKa = 9.75SRR8 pKa = 11.84FSLVIFSFFLGAFEE22 pKa = 4.93IDD24 pKa = 2.76RR25 pKa = 11.84FYY27 pKa = 11.48AGRR30 pKa = 11.84FALGLLKK37 pKa = 10.78LFTVSSFGLWWFIDD51 pKa = 3.85FVLALTGRR59 pKa = 11.84MRR61 pKa = 11.84DD62 pKa = 3.6EE63 pKa = 4.04NGLRR67 pKa = 11.84ISRR70 pKa = 11.84WW71 pKa = 3.28
MM1 pKa = 7.07FVSNKK6 pKa = 9.75SRR8 pKa = 11.84FSLVIFSFFLGAFEE22 pKa = 4.93IDD24 pKa = 2.76RR25 pKa = 11.84FYY27 pKa = 11.48AGRR30 pKa = 11.84FALGLLKK37 pKa = 10.78LFTVSSFGLWWFIDD51 pKa = 3.85FVLALTGRR59 pKa = 11.84MRR61 pKa = 11.84DD62 pKa = 3.6EE63 pKa = 4.04NGLRR67 pKa = 11.84ISRR70 pKa = 11.84WW71 pKa = 3.28
Molecular weight: 8.37 kDa
Isoelectric point according different methods:
Peptides (in silico digests for buttom-up proteomics)
Below you can find in silico digests of the whole proteome with Trypsin, Chymotrypsin, Trypsin+LysC, LysN, ArgC proteases suitable for different mass spec machines.| Try ESI |
 |
|---|
| ChTry ESI |
 |
|---|
| ArgC ESI |
 |
|---|
| LysN ESI |
 |
|---|
| TryLysC ESI |
 |
|---|
| Try MALDI |
 |
|---|
| ChTry MALDI |
 |
|---|
| ArgC MALDI |
 |
|---|
| LysN MALDI |
 |
|---|
| TryLysC MALDI |
 |
|---|
| Try LTQ |
 |
|---|
| ChTry LTQ |
 |
|---|
| ArgC LTQ |
 |
|---|
| LysN LTQ |
 |
|---|
| TryLysC LTQ |
 |
|---|
| Try MSlow |
 |
|---|
| ChTry MSlow |
 |
|---|
| ArgC MSlow |
 |
|---|
| LysN MSlow |
 |
|---|
| TryLysC MSlow |
 |
|---|
| Try MShigh |
 |
|---|
| ChTry MShigh |
 |
|---|
| ArgC MShigh |
 |
|---|
| LysN MShigh |
 |
|---|
| TryLysC MShigh |
 |
|---|
General Statistics
Number of major isoforms |
Number of additional isoforms |
Number of all proteins |
Number of amino acids |
Min. Seq. Length |
Max. Seq. Length |
Avg. Seq. Length |
Avg. Mol. Weight |
|---|---|---|---|---|---|---|---|
0 |
369893 |
29 |
4092 |
407.4 |
46.7 |
Amino acid frequency
Ala |
Cys |
Asp |
Glu |
Phe |
Gly |
His |
Ile |
Lys |
Leu |
|---|---|---|---|---|---|---|---|---|---|
5.307 ± 0.102 | 0.335 ± 0.017 |
5.426 ± 0.06 | 6.534 ± 0.069 |
5.419 ± 0.086 | 4.129 ± 0.083 |
1.314 ± 0.03 | 8.728 ± 0.089 |
10.243 ± 0.083 | 10.231 ± 0.077 |
Met |
Asn |
Gln |
Pro |
Arg |
Ser |
Thr |
Val |
Trp |
Tyr |
|---|---|---|---|---|---|---|---|---|---|
1.349 ± 0.04 | 8.544 ± 0.137 |
2.664 ± 0.048 | 4.577 ± 0.082 |
2.536 ± 0.052 | 7.152 ± 0.079 |
5.272 ± 0.088 | 5.179 ± 0.067 |
0.896 ± 0.029 | 4.164 ± 0.062 |
Most of the basic statistics you can see at this page can be downloaded from this CSV file
Proteome-pI is available under Creative Commons Attribution-NoDerivs license, for more details see here
| Reference: Kozlowski LP. Proteome-pI 2.0: Proteome Isoelectric Point Database Update. Nucleic Acids Res. 2021, doi: 10.1093/nar/gkab944 | Contact: Lukasz P. Kozlowski |
