Zostera marina (Eelgrass)
Taxonomy: cellular organisms; Eukaryota; Viridiplantae; Streptophyta; Streptophytina; Embryophyta; Tracheophyta; Euphyllophyta; Spermatophyta; Magnoliopsida; Mesangiospermae; Liliopsida; Alismatales; Zosteraceae; Zostera
Average proteome isoelectric point is 6.8
Get precalculated fractions of proteins

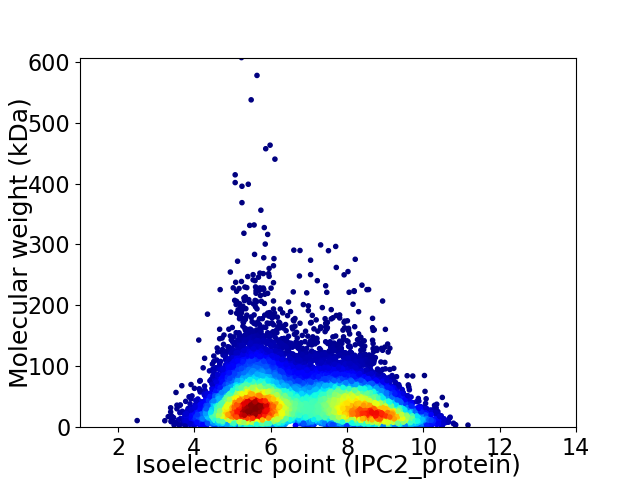
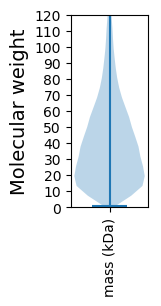
Virtual 2D-PAGE plot for 20559 proteins (isoelectric point calculated using IPC2_protein)
Get csv file with sequences according to given criteria:
* You can choose from 21 different methods for calculating isoelectric point
Summary statistics related to proteome-wise predictions


Protein with the lowest isoelectric point:
>tr|A0A0K9PTQ4|A0A0K9PTQ4_ZOSMR Uncharacterized protein OS=Zostera marina OX=29655 GN=ZOSMA_166G00610 PE=3 SV=1
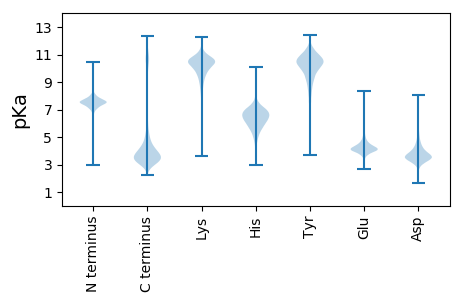
MM1 pKa = 7.96DD2 pKa = 5.29KK3 pKa = 10.33EE4 pKa = 4.21QKK6 pKa = 10.55VYY8 pKa = 11.11AGNSGKK14 pKa = 10.26AVSAGNFEE22 pKa = 4.63TNQKK26 pKa = 9.8HH27 pKa = 3.56VTYY30 pKa = 10.06WEE32 pKa = 4.35DD33 pKa = 3.59KK34 pKa = 9.66NTGEE38 pKa = 4.46YY39 pKa = 9.86IRR41 pKa = 11.84NTVTEE46 pKa = 4.01KK47 pKa = 11.07SNPNEE52 pKa = 3.6SRR54 pKa = 11.84QYY56 pKa = 9.6RR57 pKa = 11.84TTTTTVGNKK66 pKa = 7.89STGDD70 pKa = 3.61YY71 pKa = 10.34VVKK74 pKa = 10.66QSQQVCKK81 pKa = 11.02NNDD84 pKa = 3.07CRR86 pKa = 11.84TLNDD90 pKa = 3.88VIDD93 pKa = 5.01DD94 pKa = 4.29GSDD97 pKa = 3.29EE98 pKa = 4.32EE99 pKa = 5.34GVDD102 pKa = 4.84NGGCDD107 pKa = 3.07EE108 pKa = 4.4GVDD111 pKa = 4.4YY112 pKa = 11.52VRR114 pKa = 11.84DD115 pKa = 3.95DD116 pKa = 3.45QGSEE120 pKa = 4.0DD121 pKa = 4.75GDD123 pKa = 4.01GVDD126 pKa = 4.56CGGGGEE132 pKa = 4.54DD133 pKa = 5.4DD134 pKa = 4.98GYY136 pKa = 11.1DD137 pKa = 3.67YY138 pKa = 11.81SDD140 pKa = 4.51GYY142 pKa = 11.18SDD144 pKa = 5.68GVDD147 pKa = 3.6CGGGDD152 pKa = 3.8DD153 pKa = 5.93GSDD156 pKa = 2.89FDD158 pKa = 5.82YY159 pKa = 11.53YY160 pKa = 11.24DD161 pKa = 4.1GYY163 pKa = 11.89
MM1 pKa = 7.96DD2 pKa = 5.29KK3 pKa = 10.33EE4 pKa = 4.21QKK6 pKa = 10.55VYY8 pKa = 11.11AGNSGKK14 pKa = 10.26AVSAGNFEE22 pKa = 4.63TNQKK26 pKa = 9.8HH27 pKa = 3.56VTYY30 pKa = 10.06WEE32 pKa = 4.35DD33 pKa = 3.59KK34 pKa = 9.66NTGEE38 pKa = 4.46YY39 pKa = 9.86IRR41 pKa = 11.84NTVTEE46 pKa = 4.01KK47 pKa = 11.07SNPNEE52 pKa = 3.6SRR54 pKa = 11.84QYY56 pKa = 9.6RR57 pKa = 11.84TTTTTVGNKK66 pKa = 7.89STGDD70 pKa = 3.61YY71 pKa = 10.34VVKK74 pKa = 10.66QSQQVCKK81 pKa = 11.02NNDD84 pKa = 3.07CRR86 pKa = 11.84TLNDD90 pKa = 3.88VIDD93 pKa = 5.01DD94 pKa = 4.29GSDD97 pKa = 3.29EE98 pKa = 4.32EE99 pKa = 5.34GVDD102 pKa = 4.84NGGCDD107 pKa = 3.07EE108 pKa = 4.4GVDD111 pKa = 4.4YY112 pKa = 11.52VRR114 pKa = 11.84DD115 pKa = 3.95DD116 pKa = 3.45QGSEE120 pKa = 4.0DD121 pKa = 4.75GDD123 pKa = 4.01GVDD126 pKa = 4.56CGGGGEE132 pKa = 4.54DD133 pKa = 5.4DD134 pKa = 4.98GYY136 pKa = 11.1DD137 pKa = 3.67YY138 pKa = 11.81SDD140 pKa = 4.51GYY142 pKa = 11.18SDD144 pKa = 5.68GVDD147 pKa = 3.6CGGGDD152 pKa = 3.8DD153 pKa = 5.93GSDD156 pKa = 2.89FDD158 pKa = 5.82YY159 pKa = 11.53YY160 pKa = 11.24DD161 pKa = 4.1GYY163 pKa = 11.89
Molecular weight: 17.66 kDa
Isoelectric point according different methods:
Protein with the highest isoelectric point:
>tr|A0A0K9PAK4|A0A0K9PAK4_ZOSMR Uncharacterized protein OS=Zostera marina OX=29655 GN=ZOSMA_2G00130 PE=4 SV=1
MM1 pKa = 7.1RR2 pKa = 11.84AKK4 pKa = 9.27WKK6 pKa = 9.53KK7 pKa = 9.88KK8 pKa = 8.64RR9 pKa = 11.84MRR11 pKa = 11.84RR12 pKa = 11.84LKK14 pKa = 10.08RR15 pKa = 11.84KK16 pKa = 8.21RR17 pKa = 11.84RR18 pKa = 11.84KK19 pKa = 8.46MRR21 pKa = 11.84QRR23 pKa = 11.84SKK25 pKa = 11.41
MM1 pKa = 7.1RR2 pKa = 11.84AKK4 pKa = 9.27WKK6 pKa = 9.53KK7 pKa = 9.88KK8 pKa = 8.64RR9 pKa = 11.84MRR11 pKa = 11.84RR12 pKa = 11.84LKK14 pKa = 10.08RR15 pKa = 11.84KK16 pKa = 8.21RR17 pKa = 11.84RR18 pKa = 11.84KK19 pKa = 8.46MRR21 pKa = 11.84QRR23 pKa = 11.84SKK25 pKa = 11.41
Molecular weight: 3.43 kDa
Isoelectric point according different methods:
Peptides (in silico digests for buttom-up proteomics)
Below you can find in silico digests of the whole proteome with Trypsin, Chymotrypsin, Trypsin+LysC, LysN, ArgC proteases suitable for different mass spec machines.| Try ESI |
 |
|---|
| ChTry ESI |
 |
|---|
| ArgC ESI |
 |
|---|
| LysN ESI |
 |
|---|
| TryLysC ESI |
 |
|---|
| Try MALDI |
 |
|---|
| ChTry MALDI |
 |
|---|
| ArgC MALDI |
 |
|---|
| LysN MALDI |
 |
|---|
| TryLysC MALDI |
 |
|---|
| Try LTQ |
 |
|---|
| ChTry LTQ |
 |
|---|
| ArgC LTQ |
 |
|---|
| LysN LTQ |
 |
|---|
| TryLysC LTQ |
 |
|---|
| Try MSlow |
 |
|---|
| ChTry MSlow |
 |
|---|
| ArgC MSlow |
 |
|---|
| LysN MSlow |
 |
|---|
| TryLysC MSlow |
 |
|---|
| Try MShigh |
 |
|---|
| ChTry MShigh |
 |
|---|
| ArgC MShigh |
 |
|---|
| LysN MShigh |
 |
|---|
| TryLysC MShigh |
 |
|---|
General Statistics
Number of major isoforms |
Number of additional isoforms |
Number of all proteins |
Number of amino acids |
Min. Seq. Length |
Max. Seq. Length |
Avg. Seq. Length |
Avg. Mol. Weight |
|---|---|---|---|---|---|---|---|
7987506 |
8 |
5302 |
388.5 |
43.55 |
Amino acid frequency
Ala |
Cys |
Asp |
Glu |
Phe |
Gly |
His |
Ile |
Lys |
Leu |
|---|---|---|---|---|---|---|---|---|---|
5.869 ± 0.018 | 1.87 ± 0.009 |
5.575 ± 0.014 | 6.201 ± 0.018 |
4.387 ± 0.011 | 6.273 ± 0.019 |
2.446 ± 0.007 | 6.096 ± 0.011 |
6.333 ± 0.018 | 9.356 ± 0.017 |
Met |
Asn |
Gln |
Pro |
Arg |
Ser |
Thr |
Val |
Trp |
Tyr |
|---|---|---|---|---|---|---|---|---|---|
2.607 ± 0.008 | 4.849 ± 0.013 |
4.559 ± 0.016 | 3.451 ± 0.013 |
5.243 ± 0.013 | 9.185 ± 0.02 |
5.176 ± 0.011 | 6.466 ± 0.012 |
1.216 ± 0.006 | 2.843 ± 0.009 |
Most of the basic statistics you can see at this page can be downloaded from this CSV file
Proteome-pI is available under Creative Commons Attribution-NoDerivs license, for more details see here
| Reference: Kozlowski LP. Proteome-pI 2.0: Proteome Isoelectric Point Database Update. Nucleic Acids Res. 2021, doi: 10.1093/nar/gkab944 | Contact: Lukasz P. Kozlowski |
