Nylanderia fulva
Taxonomy: cellular organisms; Eukaryota; Opisthokonta; Metazoa; Eumetazoa; Bilateria; Protostomia; Ecdysozoa; Panarthropoda; Arthropoda; Mandibulata; Pancrustacea; Hexapoda; Insecta; Dicondylia; Pterygota; Neoptera; Endopterygota; Hymenoptera; Apocrita; Aculeata; Formicoidea; Formicidae;
Average proteome isoelectric point is 7.81
Get precalculated fractions of proteins

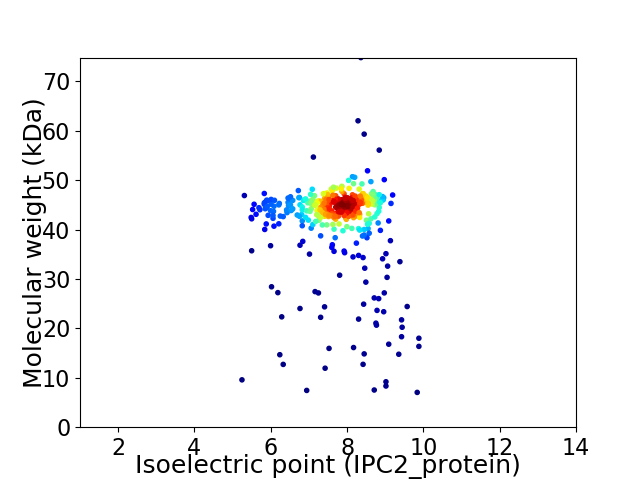
Virtual 2D-PAGE plot for 426 proteins (isoelectric point calculated using IPC2_protein)
Get csv file with sequences according to given criteria:
* You can choose from 21 different methods for calculating isoelectric point
Summary statistics related to proteome-wise predictions


Protein with the lowest isoelectric point:
>tr|A0A6G1LQH9|A0A6G1LQH9_9HYME Odorant receptor OS=Nylanderia fulva OX=613905 GN=Or-068 PE=3 SV=1
MM1 pKa = 7.32YY2 pKa = 10.56GNSTQKK8 pKa = 10.97SNDD11 pKa = 2.9VATVYY16 pKa = 10.51DD17 pKa = 3.93YY18 pKa = 11.51EE19 pKa = 5.58KK20 pKa = 11.27DD21 pKa = 3.42MRR23 pKa = 11.84FSIQLNRR30 pKa = 11.84WILKK34 pKa = 9.81PIGVWPKK41 pKa = 10.46SAGVSCGEE49 pKa = 4.34KK50 pKa = 10.26YY51 pKa = 10.99VSVLINISCISLIAFLFIPCATFVTLEE78 pKa = 4.45LEE80 pKa = 4.26DD81 pKa = 3.89TYY83 pKa = 11.58DD84 pKa = 3.83TIRR87 pKa = 11.84LFGPLNFCVMGVVKK101 pKa = 10.48YY102 pKa = 10.28SSLIIRR108 pKa = 11.84EE109 pKa = 3.6GDD111 pKa = 2.95IYY113 pKa = 11.14KK114 pKa = 10.68GIEE117 pKa = 3.98YY118 pKa = 10.66VEE120 pKa = 4.3NDD122 pKa = 3.15WTNTQYY128 pKa = 11.57YY129 pKa = 9.61DD130 pKa = 3.59DD131 pKa = 4.86QIIMMRR137 pKa = 11.84NAKK140 pKa = 9.86FGHH143 pKa = 6.41RR144 pKa = 11.84LVAICVFFMYY154 pKa = 10.39GGVVFYY160 pKa = 10.59YY161 pKa = 10.61LALPFSSGKK170 pKa = 8.14ITEE173 pKa = 4.04EE174 pKa = 4.54DD175 pKa = 3.43GNLTYY180 pKa = 10.46RR181 pKa = 11.84PLMFPVARR189 pKa = 11.84VIVDD193 pKa = 3.31ARR195 pKa = 11.84YY196 pKa = 10.25SPISEE201 pKa = 3.58IFFWIQCLSGFILHH215 pKa = 7.25SITACACSLAAVFAIHH231 pKa = 7.23AYY233 pKa = 9.96GRR235 pKa = 11.84LEE237 pKa = 5.14VLIQWIEE244 pKa = 3.83HH245 pKa = 5.71LVDD248 pKa = 3.62GRR250 pKa = 11.84EE251 pKa = 4.09DD252 pKa = 3.38FCDD255 pKa = 3.79SVDD258 pKa = 3.41EE259 pKa = 4.12RR260 pKa = 11.84LAMIVRR266 pKa = 11.84QHH268 pKa = 5.13VRR270 pKa = 11.84ILNFISLTDD279 pKa = 3.96KK280 pKa = 10.6ILRR283 pKa = 11.84EE284 pKa = 3.62ISMVEE289 pKa = 3.74VLGCTLSMCLLGYY302 pKa = 10.37SIVTEE307 pKa = 4.18WQSNEE312 pKa = 3.66PASNIVTYY320 pKa = 10.63CILLMSLTFNIFIFCYY336 pKa = 9.63IGEE339 pKa = 4.41LVAEE343 pKa = 4.29QCKK346 pKa = 10.23KK347 pKa = 9.82VGEE350 pKa = 4.19MSYY353 pKa = 10.27MIDD356 pKa = 3.32WYY358 pKa = 10.53RR359 pKa = 11.84LPGRR363 pKa = 11.84KK364 pKa = 8.87SLALILIIAMSNSSVKK380 pKa = 9.45LTAGNLFEE388 pKa = 5.9LSLSTFGDD396 pKa = 3.94VVKK399 pKa = 9.54TAVAYY404 pKa = 11.02LNMLRR409 pKa = 11.84TLTAA413 pKa = 3.87
MM1 pKa = 7.32YY2 pKa = 10.56GNSTQKK8 pKa = 10.97SNDD11 pKa = 2.9VATVYY16 pKa = 10.51DD17 pKa = 3.93YY18 pKa = 11.51EE19 pKa = 5.58KK20 pKa = 11.27DD21 pKa = 3.42MRR23 pKa = 11.84FSIQLNRR30 pKa = 11.84WILKK34 pKa = 9.81PIGVWPKK41 pKa = 10.46SAGVSCGEE49 pKa = 4.34KK50 pKa = 10.26YY51 pKa = 10.99VSVLINISCISLIAFLFIPCATFVTLEE78 pKa = 4.45LEE80 pKa = 4.26DD81 pKa = 3.89TYY83 pKa = 11.58DD84 pKa = 3.83TIRR87 pKa = 11.84LFGPLNFCVMGVVKK101 pKa = 10.48YY102 pKa = 10.28SSLIIRR108 pKa = 11.84EE109 pKa = 3.6GDD111 pKa = 2.95IYY113 pKa = 11.14KK114 pKa = 10.68GIEE117 pKa = 3.98YY118 pKa = 10.66VEE120 pKa = 4.3NDD122 pKa = 3.15WTNTQYY128 pKa = 11.57YY129 pKa = 9.61DD130 pKa = 3.59DD131 pKa = 4.86QIIMMRR137 pKa = 11.84NAKK140 pKa = 9.86FGHH143 pKa = 6.41RR144 pKa = 11.84LVAICVFFMYY154 pKa = 10.39GGVVFYY160 pKa = 10.59YY161 pKa = 10.61LALPFSSGKK170 pKa = 8.14ITEE173 pKa = 4.04EE174 pKa = 4.54DD175 pKa = 3.43GNLTYY180 pKa = 10.46RR181 pKa = 11.84PLMFPVARR189 pKa = 11.84VIVDD193 pKa = 3.31ARR195 pKa = 11.84YY196 pKa = 10.25SPISEE201 pKa = 3.58IFFWIQCLSGFILHH215 pKa = 7.25SITACACSLAAVFAIHH231 pKa = 7.23AYY233 pKa = 9.96GRR235 pKa = 11.84LEE237 pKa = 5.14VLIQWIEE244 pKa = 3.83HH245 pKa = 5.71LVDD248 pKa = 3.62GRR250 pKa = 11.84EE251 pKa = 4.09DD252 pKa = 3.38FCDD255 pKa = 3.79SVDD258 pKa = 3.41EE259 pKa = 4.12RR260 pKa = 11.84LAMIVRR266 pKa = 11.84QHH268 pKa = 5.13VRR270 pKa = 11.84ILNFISLTDD279 pKa = 3.96KK280 pKa = 10.6ILRR283 pKa = 11.84EE284 pKa = 3.62ISMVEE289 pKa = 3.74VLGCTLSMCLLGYY302 pKa = 10.37SIVTEE307 pKa = 4.18WQSNEE312 pKa = 3.66PASNIVTYY320 pKa = 10.63CILLMSLTFNIFIFCYY336 pKa = 9.63IGEE339 pKa = 4.41LVAEE343 pKa = 4.29QCKK346 pKa = 10.23KK347 pKa = 9.82VGEE350 pKa = 4.19MSYY353 pKa = 10.27MIDD356 pKa = 3.32WYY358 pKa = 10.53RR359 pKa = 11.84LPGRR363 pKa = 11.84KK364 pKa = 8.87SLALILIIAMSNSSVKK380 pKa = 9.45LTAGNLFEE388 pKa = 5.9LSLSTFGDD396 pKa = 3.94VVKK399 pKa = 9.54TAVAYY404 pKa = 11.02LNMLRR409 pKa = 11.84TLTAA413 pKa = 3.87
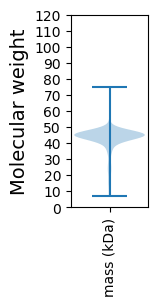
Molecular weight: 46.91 kDa
Isoelectric point according different methods:
Protein with the highest isoelectric point:
>tr|A0A6G1LPU7|A0A6G1LPU7_9HYME Odorant receptor OS=Nylanderia fulva OX=613905 GN=Or-309 PE=3 SV=1
CC1 pKa = 7.39KK2 pKa = 10.3GRR4 pKa = 11.84WYY6 pKa = 9.1YY7 pKa = 9.7TSRR10 pKa = 11.84RR11 pKa = 11.84CRR13 pKa = 11.84KK14 pKa = 9.26ILLLILNRR22 pKa = 11.84TMTPCKK28 pKa = 9.07ITAGNLMTLSIEE40 pKa = 4.18NYY42 pKa = 9.3GAVLKK47 pKa = 10.21TSMSYY52 pKa = 8.47FTMLRR57 pKa = 11.84SFQQ60 pKa = 3.48
CC1 pKa = 7.39KK2 pKa = 10.3GRR4 pKa = 11.84WYY6 pKa = 9.1YY7 pKa = 9.7TSRR10 pKa = 11.84RR11 pKa = 11.84CRR13 pKa = 11.84KK14 pKa = 9.26ILLLILNRR22 pKa = 11.84TMTPCKK28 pKa = 9.07ITAGNLMTLSIEE40 pKa = 4.18NYY42 pKa = 9.3GAVLKK47 pKa = 10.21TSMSYY52 pKa = 8.47FTMLRR57 pKa = 11.84SFQQ60 pKa = 3.48
Molecular weight: 7.05 kDa
Isoelectric point according different methods:
Peptides (in silico digests for buttom-up proteomics)
Below you can find in silico digests of the whole proteome with Trypsin, Chymotrypsin, Trypsin+LysC, LysN, ArgC proteases suitable for different mass spec machines.| Try ESI |
 |
|---|
| ChTry ESI |
 |
|---|
| ArgC ESI |
 |
|---|
| LysN ESI |
 |
|---|
| TryLysC ESI |
 |
|---|
| Try MALDI |
 |
|---|
| ChTry MALDI |
 |
|---|
| ArgC MALDI |
 |
|---|
| LysN MALDI |
 |
|---|
| TryLysC MALDI |
 |
|---|
| Try LTQ |
 |
|---|
| ChTry LTQ |
 |
|---|
| ArgC LTQ |
 |
|---|
| LysN LTQ |
 |
|---|
| TryLysC LTQ |
 |
|---|
| Try MSlow |
 |
|---|
| ChTry MSlow |
 |
|---|
| ArgC MSlow |
 |
|---|
| LysN MSlow |
 |
|---|
| TryLysC MSlow |
 |
|---|
| Try MShigh |
 |
|---|
| ChTry MShigh |
 |
|---|
| ArgC MShigh |
 |
|---|
| LysN MShigh |
 |
|---|
| TryLysC MShigh |
 |
|---|
General Statistics
Number of major isoforms |
Number of additional isoforms |
Number of all proteins |
Number of amino acids |
Min. Seq. Length |
Max. Seq. Length |
Avg. Seq. Length |
Avg. Mol. Weight |
|---|---|---|---|---|---|---|---|
0 |
155503 |
60 |
644 |
365.0 |
42.12 |
Amino acid frequency
Ala |
Cys |
Asp |
Glu |
Phe |
Gly |
His |
Ile |
Lys |
Leu |
|---|---|---|---|---|---|---|---|---|---|
5.371 ± 0.053 | 2.63 ± 0.039 |
3.19 ± 0.041 | 3.771 ± 0.042 |
6.726 ± 0.064 | 3.525 ± 0.046 |
2.087 ± 0.038 | 11.108 ± 0.091 |
4.739 ± 0.04 | 12.381 ± 0.07 |
Met |
Asn |
Gln |
Pro |
Arg |
Ser |
Thr |
Val |
Trp |
Tyr |
|---|---|---|---|---|---|---|---|---|---|
4.094 ± 0.042 | 4.569 ± 0.049 |
2.33 ± 0.041 | 3.383 ± 0.042 |
3.968 ± 0.055 | 7.139 ± 0.075 |
6.307 ± 0.054 | 6.459 ± 0.056 |
1.323 ± 0.023 | 4.898 ± 0.056 |
Most of the basic statistics you can see at this page can be downloaded from this CSV file
Proteome-pI is available under Creative Commons Attribution-NoDerivs license, for more details see here
| Reference: Kozlowski LP. Proteome-pI 2.0: Proteome Isoelectric Point Database Update. Nucleic Acids Res. 2021, doi: 10.1093/nar/gkab944 | Contact: Lukasz P. Kozlowski |
