Sandarakinorhabdus cyanobacteriorum
Taxonomy: cellular organisms; Bacteria; Proteobacteria; Alphaproteobacteria; Sphingomonadales; Sphingosinicellaceae; Sandarakinorhabdus
Average proteome isoelectric point is 6.88
Get precalculated fractions of proteins
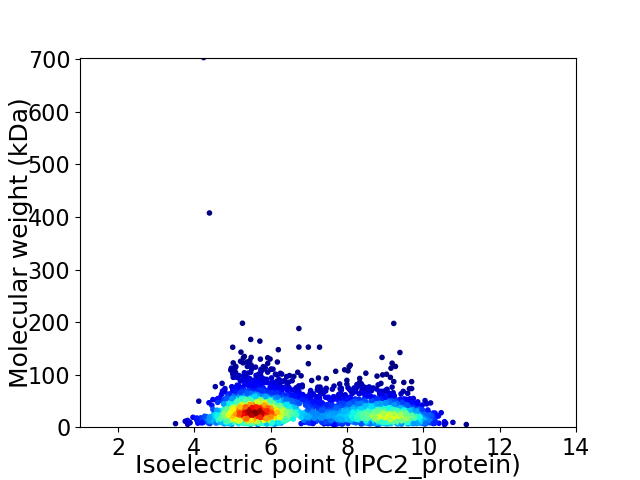
Virtual 2D-PAGE plot for 3280 proteins (isoelectric point calculated using IPC2_protein)
Get csv file with sequences according to given criteria:
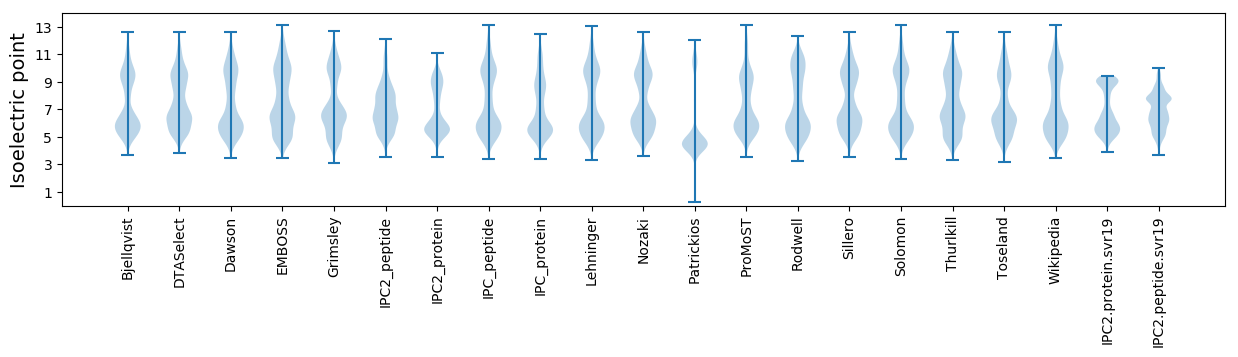
* You can choose from 21 different methods for calculating isoelectric point
Summary statistics related to proteome-wise predictions
Protein with the lowest isoelectric point:
>tr|A0A255YZX0|A0A255YZX0_9SPHN Histidinol dehydrogenase OS=Sandarakinorhabdus cyanobacteriorum OX=1981098 GN=hisD PE=3 SV=1
MM1 pKa = 7.92RR2 pKa = 11.84STFGSASVRR11 pKa = 11.84LYY13 pKa = 11.16YY14 pKa = 10.51LDD16 pKa = 5.69DD17 pKa = 5.11GDD19 pKa = 5.3PVAQTLFYY27 pKa = 10.99GPLDD31 pKa = 3.72EE32 pKa = 5.8ALALAAAQPEE42 pKa = 4.36AVQAGLWIATDD53 pKa = 3.6NDD55 pKa = 3.1VAAYY59 pKa = 10.59LDD61 pKa = 5.29LIDD64 pKa = 4.36
MM1 pKa = 7.92RR2 pKa = 11.84STFGSASVRR11 pKa = 11.84LYY13 pKa = 11.16YY14 pKa = 10.51LDD16 pKa = 5.69DD17 pKa = 5.11GDD19 pKa = 5.3PVAQTLFYY27 pKa = 10.99GPLDD31 pKa = 3.72EE32 pKa = 5.8ALALAAAQPEE42 pKa = 4.36AVQAGLWIATDD53 pKa = 3.6NDD55 pKa = 3.1VAAYY59 pKa = 10.59LDD61 pKa = 5.29LIDD64 pKa = 4.36
Molecular weight: 6.85 kDa
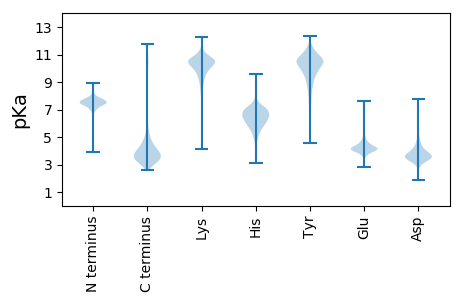
Isoelectric point according different methods:
Protein with the highest isoelectric point:
>tr|A0A255YEL1|A0A255YEL1_9SPHN Uncharacterized protein OS=Sandarakinorhabdus cyanobacteriorum OX=1981098 GN=CHU93_11185 PE=4 SV=1
MM1 pKa = 7.35KK2 pKa = 9.43RR3 pKa = 11.84TYY5 pKa = 10.27QPSKK9 pKa = 9.43LVRR12 pKa = 11.84ARR14 pKa = 11.84RR15 pKa = 11.84HH16 pKa = 4.38GFRR19 pKa = 11.84ARR21 pKa = 11.84MATVGGRR28 pKa = 11.84KK29 pKa = 9.31VIAARR34 pKa = 11.84RR35 pKa = 11.84ARR37 pKa = 11.84GRR39 pKa = 11.84KK40 pKa = 9.21KK41 pKa = 9.68LTAA44 pKa = 4.27
MM1 pKa = 7.35KK2 pKa = 9.43RR3 pKa = 11.84TYY5 pKa = 10.27QPSKK9 pKa = 9.43LVRR12 pKa = 11.84ARR14 pKa = 11.84RR15 pKa = 11.84HH16 pKa = 4.38GFRR19 pKa = 11.84ARR21 pKa = 11.84MATVGGRR28 pKa = 11.84KK29 pKa = 9.31VIAARR34 pKa = 11.84RR35 pKa = 11.84ARR37 pKa = 11.84GRR39 pKa = 11.84KK40 pKa = 9.21KK41 pKa = 9.68LTAA44 pKa = 4.27
Molecular weight: 5.07 kDa
Isoelectric point according different methods:
Peptides (in silico digests for buttom-up proteomics)
Below you can find in silico digests of the whole proteome with Trypsin, Chymotrypsin, Trypsin+LysC, LysN, ArgC proteases suitable for different mass spec machines.| Try ESI |
 |
|---|
| ChTry ESI |
|
|---|
| ArgC ESI |
|
|---|
| LysN ESI |
|
|---|
| TryLysC ESI |
|
|---|
| Try MALDI |
|
|---|
| ChTry MALDI |
|
|---|
| ArgC MALDI |
|
|---|
| LysN MALDI |
|
|---|
| TryLysC MALDI |
|
|---|
| Try LTQ |
|
|---|
| ChTry LTQ |
|
|---|
| ArgC LTQ |
|
|---|
| LysN LTQ |
|
|---|
| TryLysC LTQ |
|
|---|
| Try MSlow |
|
|---|
| ChTry MSlow |
|
|---|
| ArgC MSlow |
|
|---|
| LysN MSlow |
|
|---|
| TryLysC MSlow |
|
|---|
| Try MShigh |
|
|---|
| ChTry MShigh |
|
|---|
| ArgC MShigh |
|
|---|
| LysN MShigh |
|
|---|
| TryLysC MShigh |
|
|---|
General Statistics
Number of major isoforms |
Number of additional isoforms |
Number of all proteins |
Number of amino acids |
Min. Seq. Length |
Max. Seq. Length |
Avg. Seq. Length |
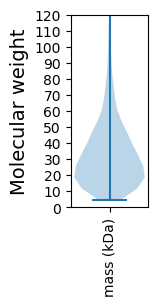
Avg. Mol. Weight |
|---|---|---|---|---|---|---|---|
0 |
1058910 |
41 |
7554 |
322.8 |
34.55 |
Amino acid frequency
Ala |
Cys |
Asp |
Glu |
Phe |
Gly |
His |
Ile |
Lys |
Leu |
|---|---|---|---|---|---|---|---|---|---|
14.819 ± 0.082 | 0.784 ± 0.014 |
5.667 ± 0.033 | 4.674 ± 0.044 |
3.379 ± 0.025 | 9.248 ± 0.109 |
1.979 ± 0.025 | 4.716 ± 0.028 |
2.732 ± 0.037 | 10.391 ± 0.051 |
Met |
Asn |
Gln |
Pro |
Arg |
Ser |
Thr |
Val |
Trp |
Tyr |
|---|---|---|---|---|---|---|---|---|---|
2.366 ± 0.024 | 2.569 ± 0.05 |
5.734 ± 0.048 | 3.244 ± 0.02 |
7.284 ± 0.053 | 4.751 ± 0.046 |
5.093 ± 0.058 | 7.095 ± 0.033 |
1.579 ± 0.022 | 1.896 ± 0.021 |
Most of the basic statistics you can see at this page can be downloaded from this CSV file
See this proteome in:

Proteome-pI is available under Creative Commons Attribution-NoDerivs license, for more details see here
| Reference: Kozlowski LP. Proteome-pI 2.0: Proteome Isoelectric Point Database Update. Nucleic Acids Res. 2021, doi: 10.1093/nar/gkab944 | Contact: Lukasz P. Kozlowski |