Halomonas beimenensis
Taxonomy: cellular organisms; Bacteria; Proteobacteria; Gammaproteobacteria; Oceanospirillales; Halomonadaceae; Halomonas
Average proteome isoelectric point is 6.2
Get precalculated fractions of proteins

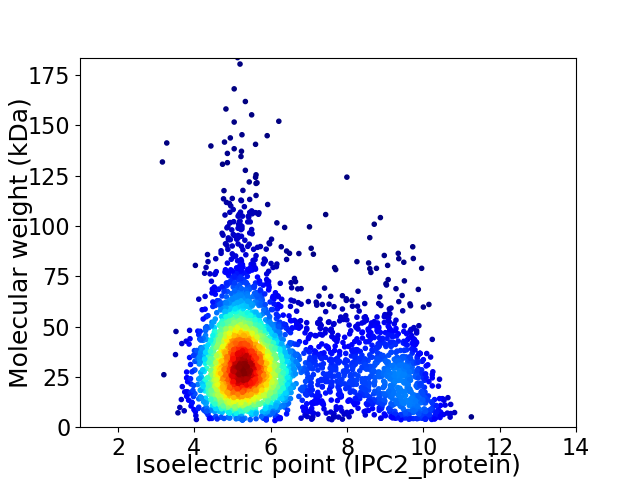
Virtual 2D-PAGE plot for 3771 proteins (isoelectric point calculated using IPC2_protein)
Get csv file with sequences according to given criteria:
* You can choose from 21 different methods for calculating isoelectric point
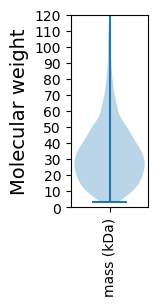
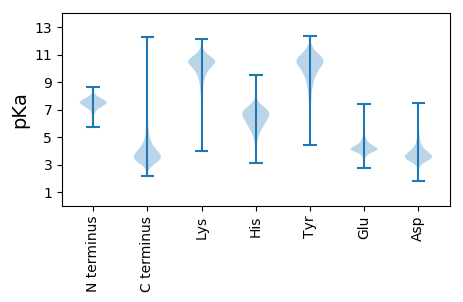
Summary statistics related to proteome-wise predictions


Protein with the lowest isoelectric point:
>tr|A0A291P556|A0A291P556_9GAMM Uncharacterized protein OS=Halomonas beimenensis OX=475662 GN=BEI_1030 PE=4 SV=1
MM1 pKa = 7.18KK2 pKa = 10.01TMHH5 pKa = 7.64LITATAFAAAGLVAAQSAYY24 pKa = 10.4AYY26 pKa = 9.67QAGDD30 pKa = 3.01IYY32 pKa = 11.49VRR34 pKa = 11.84GGIAKK39 pKa = 8.98TEE41 pKa = 4.04VTDD44 pKa = 5.13DD45 pKa = 3.56NGTLDD50 pKa = 3.42VAGEE54 pKa = 4.15LDD56 pKa = 3.82ISDD59 pKa = 4.34EE60 pKa = 4.21SHH62 pKa = 6.56LAYY65 pKa = 10.51ALGYY69 pKa = 10.12LFHH72 pKa = 7.67DD73 pKa = 3.49KK74 pKa = 10.4WGMEE78 pKa = 3.97LSGAEE83 pKa = 4.06PVEE86 pKa = 4.3HH87 pKa = 6.43QLNTGNLGDD96 pKa = 3.41IGGVDD101 pKa = 3.9RR102 pKa = 11.84MPVNLMVNYY111 pKa = 9.83YY112 pKa = 9.74PLGGTGAKK120 pKa = 8.37VQPYY124 pKa = 9.84VGAGLNYY131 pKa = 9.72TRR133 pKa = 11.84FSDD136 pKa = 4.31EE137 pKa = 4.38EE138 pKa = 4.58LDD140 pKa = 4.0GLDD143 pKa = 4.36VDD145 pKa = 4.64EE146 pKa = 4.82SWGAVGQVGVDD157 pKa = 3.73LAITDD162 pKa = 3.95YY163 pKa = 11.57LLAGAFARR171 pKa = 11.84YY172 pKa = 9.93ADD174 pKa = 3.39VDD176 pKa = 3.78ADD178 pKa = 3.86VSVGGTDD185 pKa = 2.79IGEE188 pKa = 4.41AEE190 pKa = 4.52VDD192 pKa = 3.44PMTVGGVLTFRR203 pKa = 11.84FF204 pKa = 3.96
MM1 pKa = 7.18KK2 pKa = 10.01TMHH5 pKa = 7.64LITATAFAAAGLVAAQSAYY24 pKa = 10.4AYY26 pKa = 9.67QAGDD30 pKa = 3.01IYY32 pKa = 11.49VRR34 pKa = 11.84GGIAKK39 pKa = 8.98TEE41 pKa = 4.04VTDD44 pKa = 5.13DD45 pKa = 3.56NGTLDD50 pKa = 3.42VAGEE54 pKa = 4.15LDD56 pKa = 3.82ISDD59 pKa = 4.34EE60 pKa = 4.21SHH62 pKa = 6.56LAYY65 pKa = 10.51ALGYY69 pKa = 10.12LFHH72 pKa = 7.67DD73 pKa = 3.49KK74 pKa = 10.4WGMEE78 pKa = 3.97LSGAEE83 pKa = 4.06PVEE86 pKa = 4.3HH87 pKa = 6.43QLNTGNLGDD96 pKa = 3.41IGGVDD101 pKa = 3.9RR102 pKa = 11.84MPVNLMVNYY111 pKa = 9.83YY112 pKa = 9.74PLGGTGAKK120 pKa = 8.37VQPYY124 pKa = 9.84VGAGLNYY131 pKa = 9.72TRR133 pKa = 11.84FSDD136 pKa = 4.31EE137 pKa = 4.38EE138 pKa = 4.58LDD140 pKa = 4.0GLDD143 pKa = 4.36VDD145 pKa = 4.64EE146 pKa = 4.82SWGAVGQVGVDD157 pKa = 3.73LAITDD162 pKa = 3.95YY163 pKa = 11.57LLAGAFARR171 pKa = 11.84YY172 pKa = 9.93ADD174 pKa = 3.39VDD176 pKa = 3.78ADD178 pKa = 3.86VSVGGTDD185 pKa = 2.79IGEE188 pKa = 4.41AEE190 pKa = 4.52VDD192 pKa = 3.44PMTVGGVLTFRR203 pKa = 11.84FF204 pKa = 3.96
Molecular weight: 21.45 kDa
Isoelectric point according different methods:
Protein with the highest isoelectric point:
>tr|A0A291P291|A0A291P291_9GAMM Beta sliding clamp OS=Halomonas beimenensis OX=475662 GN=BEI_0002 PE=3 SV=1
MM1 pKa = 7.45KK2 pKa = 9.51RR3 pKa = 11.84TFQPSVLKK11 pKa = 10.42RR12 pKa = 11.84KK13 pKa = 9.04RR14 pKa = 11.84AHH16 pKa = 6.12GFRR19 pKa = 11.84ARR21 pKa = 11.84MATKK25 pKa = 10.3NGRR28 pKa = 11.84AVLARR33 pKa = 11.84RR34 pKa = 11.84RR35 pKa = 11.84AKK37 pKa = 9.93GRR39 pKa = 11.84KK40 pKa = 8.85RR41 pKa = 11.84LSAA44 pKa = 3.96
MM1 pKa = 7.45KK2 pKa = 9.51RR3 pKa = 11.84TFQPSVLKK11 pKa = 10.42RR12 pKa = 11.84KK13 pKa = 9.04RR14 pKa = 11.84AHH16 pKa = 6.12GFRR19 pKa = 11.84ARR21 pKa = 11.84MATKK25 pKa = 10.3NGRR28 pKa = 11.84AVLARR33 pKa = 11.84RR34 pKa = 11.84RR35 pKa = 11.84AKK37 pKa = 9.93GRR39 pKa = 11.84KK40 pKa = 8.85RR41 pKa = 11.84LSAA44 pKa = 3.96
Molecular weight: 5.12 kDa
Isoelectric point according different methods:
Peptides (in silico digests for buttom-up proteomics)
Below you can find in silico digests of the whole proteome with Trypsin, Chymotrypsin, Trypsin+LysC, LysN, ArgC proteases suitable for different mass spec machines.| Try ESI |
 |
|---|
| ChTry ESI |
 |
|---|
| ArgC ESI |
 |
|---|
| LysN ESI |
 |
|---|
| TryLysC ESI |
 |
|---|
| Try MALDI |
 |
|---|
| ChTry MALDI |
 |
|---|
| ArgC MALDI |
 |
|---|
| LysN MALDI |
 |
|---|
| TryLysC MALDI |
 |
|---|
| Try LTQ |
 |
|---|
| ChTry LTQ |
 |
|---|
| ArgC LTQ |
 |
|---|
| LysN LTQ |
 |
|---|
| TryLysC LTQ |
 |
|---|
| Try MSlow |
 |
|---|
| ChTry MSlow |
 |
|---|
| ArgC MSlow |
 |
|---|
| LysN MSlow |
 |
|---|
| TryLysC MSlow |
 |
|---|
| Try MShigh |
 |
|---|
| ChTry MShigh |
 |
|---|
| ArgC MShigh |
 |
|---|
| LysN MShigh |
 |
|---|
| TryLysC MShigh |
 |
|---|
General Statistics
Number of major isoforms |
Number of additional isoforms |
Number of all proteins |
Number of amino acids |
Min. Seq. Length |
Max. Seq. Length |
Avg. Seq. Length |
Avg. Mol. Weight |
|---|---|---|---|---|---|---|---|
0 |
1196699 |
30 |
1623 |
317.3 |
34.74 |
Amino acid frequency
Ala |
Cys |
Asp |
Glu |
Phe |
Gly |
His |
Ile |
Lys |
Leu |
|---|---|---|---|---|---|---|---|---|---|
12.035 ± 0.055 | 0.947 ± 0.014 |
5.839 ± 0.034 | 6.79 ± 0.045 |
3.336 ± 0.026 | 8.675 ± 0.037 |
2.501 ± 0.019 | 4.161 ± 0.03 |
2.214 ± 0.03 | 11.781 ± 0.054 |
Met |
Asn |
Gln |
Pro |
Arg |
Ser |
Thr |
Val |
Trp |
Tyr |
|---|---|---|---|---|---|---|---|---|---|
2.348 ± 0.018 | 2.075 ± 0.024 |
5.326 ± 0.032 | 3.321 ± 0.025 |
8.225 ± 0.048 | 4.698 ± 0.025 |
4.763 ± 0.026 | 7.259 ± 0.031 |
1.501 ± 0.02 | 2.205 ± 0.018 |
Most of the basic statistics you can see at this page can be downloaded from this CSV file
Proteome-pI is available under Creative Commons Attribution-NoDerivs license, for more details see here
| Reference: Kozlowski LP. Proteome-pI 2.0: Proteome Isoelectric Point Database Update. Nucleic Acids Res. 2021, doi: 10.1093/nar/gkab944 | Contact: Lukasz P. Kozlowski |
