Erythrobacter sp. NAP1
Taxonomy: cellular organisms; Bacteria; Proteobacteria; Alphaproteobacteria; Sphingomonadales; Erythrobacteraceae; Erythrobacter/Porphyrobacter group; Erythrobacter; unclassified Erythrobacter
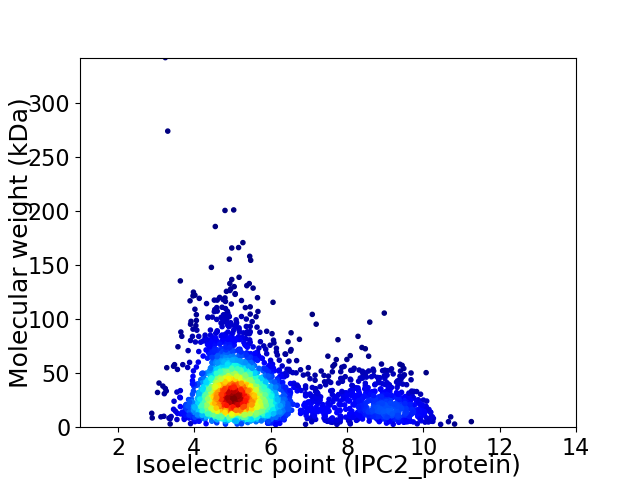
Average proteome isoelectric point is 5.77
Get precalculated fractions of proteins

Virtual 2D-PAGE plot for 3177 proteins (isoelectric point calculated using IPC2_protein)
Get csv file with sequences according to given criteria:
* You can choose from 21 different methods for calculating isoelectric point
Summary statistics related to proteome-wise predictions


Protein with the lowest isoelectric point:
>tr|A3WGC5|A3WGC5_9SPHN Riboflavin synthase subunit alpha OS=Erythrobacter sp. NAP1 OX=237727 GN=NAP1_15628 PE=4 SV=1
MM1 pKa = 6.84NTLAKK6 pKa = 10.35SPSFAFAASVVAPLALVLSACGSEE30 pKa = 3.82PAVPVEE36 pKa = 3.93PPLYY40 pKa = 9.78GATIGGEE47 pKa = 3.84FDD49 pKa = 3.63LQNTSGEE56 pKa = 4.2AVKK59 pKa = 9.75WADD62 pKa = 3.2FNGQYY67 pKa = 10.22RR68 pKa = 11.84IVYY71 pKa = 9.47FGYY74 pKa = 10.32AYY76 pKa = 10.78CPDD79 pKa = 3.5ICPTDD84 pKa = 3.36VQRR87 pKa = 11.84TVQGLNQFTDD97 pKa = 3.73EE98 pKa = 4.07NPEE101 pKa = 4.13LGEE104 pKa = 3.81QVQPIFISVDD114 pKa = 3.3PDD116 pKa = 3.33RR117 pKa = 11.84DD118 pKa = 3.69TPEE121 pKa = 3.87VVEE124 pKa = 4.34EE125 pKa = 3.89FTNAFSEE132 pKa = 4.31RR133 pKa = 11.84LIGLTGSPDD142 pKa = 3.66QIADD146 pKa = 3.38AAKK149 pKa = 9.52TFGVYY154 pKa = 7.34YY155 pKa = 10.0TKK157 pKa = 10.71LDD159 pKa = 3.67SPSPDD164 pKa = 3.52TYY166 pKa = 11.65LMDD169 pKa = 3.95HH170 pKa = 6.49SRR172 pKa = 11.84TVLLFGPQGEE182 pKa = 4.43PLALLPADD190 pKa = 4.78LGADD194 pKa = 3.34AVAEE198 pKa = 4.03EE199 pKa = 4.28LGKK202 pKa = 9.83WVTT205 pKa = 3.61
MM1 pKa = 6.84NTLAKK6 pKa = 10.35SPSFAFAASVVAPLALVLSACGSEE30 pKa = 3.82PAVPVEE36 pKa = 3.93PPLYY40 pKa = 9.78GATIGGEE47 pKa = 3.84FDD49 pKa = 3.63LQNTSGEE56 pKa = 4.2AVKK59 pKa = 9.75WADD62 pKa = 3.2FNGQYY67 pKa = 10.22RR68 pKa = 11.84IVYY71 pKa = 9.47FGYY74 pKa = 10.32AYY76 pKa = 10.78CPDD79 pKa = 3.5ICPTDD84 pKa = 3.36VQRR87 pKa = 11.84TVQGLNQFTDD97 pKa = 3.73EE98 pKa = 4.07NPEE101 pKa = 4.13LGEE104 pKa = 3.81QVQPIFISVDD114 pKa = 3.3PDD116 pKa = 3.33RR117 pKa = 11.84DD118 pKa = 3.69TPEE121 pKa = 3.87VVEE124 pKa = 4.34EE125 pKa = 3.89FTNAFSEE132 pKa = 4.31RR133 pKa = 11.84LIGLTGSPDD142 pKa = 3.66QIADD146 pKa = 3.38AAKK149 pKa = 9.52TFGVYY154 pKa = 7.34YY155 pKa = 10.0TKK157 pKa = 10.71LDD159 pKa = 3.67SPSPDD164 pKa = 3.52TYY166 pKa = 11.65LMDD169 pKa = 3.95HH170 pKa = 6.49SRR172 pKa = 11.84TVLLFGPQGEE182 pKa = 4.43PLALLPADD190 pKa = 4.78LGADD194 pKa = 3.34AVAEE198 pKa = 4.03EE199 pKa = 4.28LGKK202 pKa = 9.83WVTT205 pKa = 3.61
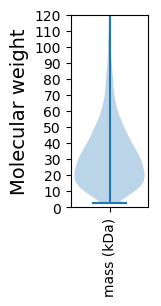
Molecular weight: 22.06 kDa
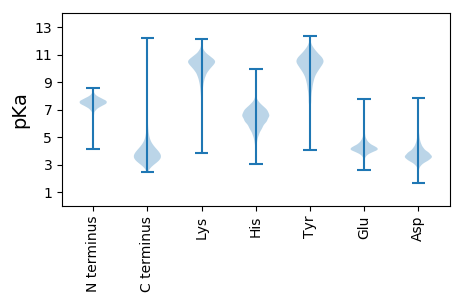
Isoelectric point according different methods:
Protein with the highest isoelectric point:
>tr|A3WFH0|A3WFH0_9SPHN NAD-dependent protein deacylase OS=Erythrobacter sp. NAP1 OX=237727 GN=cobB PE=3 SV=1
MM1 pKa = 7.45KK2 pKa = 9.61RR3 pKa = 11.84TFQPSNLVRR12 pKa = 11.84ARR14 pKa = 11.84RR15 pKa = 11.84HH16 pKa = 4.89GFFARR21 pKa = 11.84KK22 pKa = 7.42ATPGGRR28 pKa = 11.84KK29 pKa = 9.21VIRR32 pKa = 11.84ARR34 pKa = 11.84RR35 pKa = 11.84KK36 pKa = 8.83RR37 pKa = 11.84GRR39 pKa = 11.84KK40 pKa = 9.03KK41 pKa = 10.62LSAA44 pKa = 4.03
MM1 pKa = 7.45KK2 pKa = 9.61RR3 pKa = 11.84TFQPSNLVRR12 pKa = 11.84ARR14 pKa = 11.84RR15 pKa = 11.84HH16 pKa = 4.89GFFARR21 pKa = 11.84KK22 pKa = 7.42ATPGGRR28 pKa = 11.84KK29 pKa = 9.21VIRR32 pKa = 11.84ARR34 pKa = 11.84RR35 pKa = 11.84KK36 pKa = 8.83RR37 pKa = 11.84GRR39 pKa = 11.84KK40 pKa = 9.03KK41 pKa = 10.62LSAA44 pKa = 4.03
Molecular weight: 5.15 kDa
Isoelectric point according different methods:
Peptides (in silico digests for buttom-up proteomics)
Below you can find in silico digests of the whole proteome with Trypsin, Chymotrypsin, Trypsin+LysC, LysN, ArgC proteases suitable for different mass spec machines.| Try ESI |
 |
|---|
| ChTry ESI |
 |
|---|
| ArgC ESI |
 |
|---|
| LysN ESI |
 |
|---|
| TryLysC ESI |
 |
|---|
| Try MALDI |
 |
|---|
| ChTry MALDI |
 |
|---|
| ArgC MALDI |
 |
|---|
| LysN MALDI |
 |
|---|
| TryLysC MALDI |
 |
|---|
| Try LTQ |
 |
|---|
| ChTry LTQ |
 |
|---|
| ArgC LTQ |
 |
|---|
| LysN LTQ |
 |
|---|
| TryLysC LTQ |
 |
|---|
| Try MSlow |
 |
|---|
| ChTry MSlow |
 |
|---|
| ArgC MSlow |
 |
|---|
| LysN MSlow |
 |
|---|
| TryLysC MSlow |
 |
|---|
| Try MShigh |
 |
|---|
| ChTry MShigh |
 |
|---|
| ArgC MShigh |
 |
|---|
| LysN MShigh |
 |
|---|
| TryLysC MShigh |
 |
|---|
General Statistics
Number of major isoforms |
Number of additional isoforms |
Number of all proteins |
Number of amino acids |
Min. Seq. Length |
Max. Seq. Length |
Avg. Seq. Length |
Avg. Mol. Weight |
|---|---|---|---|---|---|---|---|
0 |
1002534 |
21 |
3529 |
315.6 |
34.24 |
Amino acid frequency
Ala |
Cys |
Asp |
Glu |
Phe |
Gly |
His |
Ile |
Lys |
Leu |
|---|---|---|---|---|---|---|---|---|---|
12.262 ± 0.064 | 0.793 ± 0.014 |
6.198 ± 0.035 | 6.819 ± 0.044 |
3.825 ± 0.029 | 8.759 ± 0.058 |
1.864 ± 0.022 | 5.232 ± 0.03 |
3.188 ± 0.043 | 9.536 ± 0.048 |
Met |
Asn |
Gln |
Pro |
Arg |
Ser |
Thr |
Val |
Trp |
Tyr |
|---|---|---|---|---|---|---|---|---|---|
2.528 ± 0.021 | 2.805 ± 0.031 |
4.97 ± 0.032 | 3.163 ± 0.025 |
6.612 ± 0.047 | 5.697 ± 0.035 |
5.247 ± 0.033 | 6.937 ± 0.03 |
1.387 ± 0.02 | 2.179 ± 0.026 |
Most of the basic statistics you can see at this page can be downloaded from this CSV file
Proteome-pI is available under Creative Commons Attribution-NoDerivs license, for more details see here
| Reference: Kozlowski LP. Proteome-pI 2.0: Proteome Isoelectric Point Database Update. Nucleic Acids Res. 2021, doi: 10.1093/nar/gkab944 | Contact: Lukasz P. Kozlowski |
